-

 Pie Chart displays projects by Baseline Finish Variance—is current project finish beyond baseline finish; or is current project finish on or before baseline finish. Filterable by OBS structure and Finish Date range. Data labels show percent within baseline vs percent outside baseline. Mouse-over shows Within or Outside label and percent of total projects. Legend shows color coded Within Baseline and Outside Baseline labels. Drilldown: Clicking on a pie slice yields a grid portlet of projects either Within or Outside Baseline.
 -
Pie Chart displays projects by Baseline Finish Variance—is current project finish beyond baseline finish; or is current project finish on or before baseline finish. Filterable by OBS structure and Finish Date range. Data labels show percent within baseline vs percent outside baseline. Mouse-over shows Within or Outside label and percent of total projects. Legend shows color coded Within Baseline and Outside Baseline labels. Drilldown: Clicking on a pie slice yields a grid portlet of projects either Within or Outside Baseline.
-
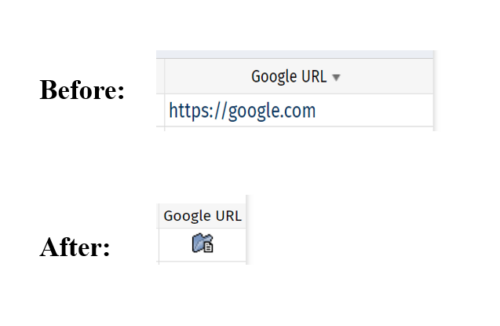 This tech-trick defines how a URL attribute can be changed to an image in a list view via CSS.
 -
 A tech trick document that assists you in update Data Source when utilizing the Power BI reports found in RegoXchange.
 -
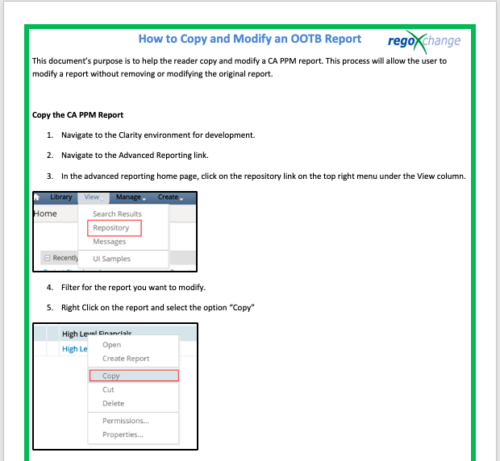 This document’s purpose is to help the reader copy and modify a CA PPM report. This process will allow the user to modify a report without removing or modifying the original report.
 -
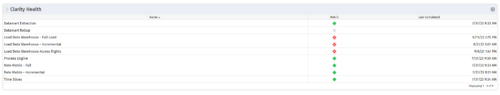 The Clarity Health portlet provides a quick glance into the health of key components and critical jobs in the Clarity environment. The following metrics are monitored: Process Engine Heartbeat should refresh itself every 10 minutes. Process Engine is responsible for the triggering of processes. Green <= 10 Minutes, Yellow 11-15 Minutes, Red > 15 Minutes Time Slices Time Slices are required for accurate reporting. Best practice is for the Time Slicing job to run every minute. Please note there are some jobs that will cause the time slicing to delay so a momentary delay is normal. Green <= 10 Minutes, Yellow 11-15 Minutes, Red > 15 Minutes Datamart Extraction Green <= 24 Hours, Yellow 24-48 hours, Red > 48 hours Datamart Rollup Green <= 24 Hours, Yellow 24-48 hours, Red > 48 hours Rate Matrix - Full Best practice is to run a full rate matrix nightly Green <= 24 Hours, Yellow 24-48 hours, Red > 48 hours Rate Matrix - Incremental Green <= 24 Hours, Yellow 24-48 hours, Red > 48 hours Load Data Warehouse - Full Load Green <= 24 Hours, Yellow 24-48 hours, Red > 48 hours Load Data Warehouse - Incremental Green <= 24 Hours, Yellow 24-48 hours, Red > 48 hours Load Data Warehouse Access Rights Green <= 24 Hours, Yellow 24-48 hours, Red > 48 hours
 -
 The Clarity Health portlet provides a quick glance into the health of key components and critical jobs in the Clarity environment. The following metrics are monitored: Process Engine Heartbeat should refresh itself every 10 minutes. Process Engine is responsible for the triggering of processes. Green <= 10 Minutes, Yellow 11-15 Minutes, Red > 15 Minutes Time Slices Time Slices are required for accurate reporting. Best practice is for the Time Slicing job to run every minute. Please note there are some jobs that will cause the time slicing to delay so a momentary delay is normal. Green <= 10 Minutes, Yellow 11-15 Minutes, Red > 15 Minutes Datamart Extraction Green <= 24 Hours, Yellow 24-48 hours, Red > 48 hours Datamart Rollup Green <= 24 Hours, Yellow 24-48 hours, Red > 48 hours Rate Matrix - Full Best practice is to run a full rate matrix nightly Green <= 24 Hours, Yellow 24-48 hours, Red > 48 hours Rate Matrix - Incremental Green <= 24 Hours, Yellow 24-48 hours, Red > 48 hours Load Data Warehouse - Full Load Green <= 24 Hours, Yellow 24-48 hours, Red > 48 hours Load Data Warehouse - Incremental Green <= 24 Hours, Yellow 24-48 hours, Red > 48 hours Load Data Warehouse Access Rights Green <= 24 Hours, Yellow 24-48 hours, Red > 48 hours The Clarity Health portlet provides a quick glance into the health of key components and critical jobs in the Clarity environment. The following metrics are monitored: Process Engine Heartbeat should refresh itself every 10 minutes. Process Engine is responsible for the triggering of processes. Green <= 10 Minutes, Yellow 11-15 Minutes, Red > 15 Minutes Time Slices Time Slices are required for accurate reporting. Best practice is for the Time Slicing job to run every minute. Please note there are some jobs that will cause the time slicing to delay so a momentary delay is normal. Green <= 10 Minutes, Yellow 11-15 Minutes, Red > 15 Minutes Datamart Extraction Green <= 24 Hours, Yellow 24-48 hours, Red > 48 hours Datamart Rollup Green <= 24 Hours, Yellow 24-48 hours, Red > 48 hours Rate Matrix - Full Best practice is to run a full rate matrix nightly Green <= 24 Hours, Yellow 24-48 hours, Red > 48 hours Rate Matrix - Incremental Green <= 24 Hours, Yellow 24-48 hours, Red > 48 hours Load Data Warehouse - Full Load Green <= 24 Hours, Yellow 24-48 hours, Red > 48 hours Load Data Warehouse - Incremental Green <= 24 Hours, Yellow 24-48 hours, Red > 48 hours Load Data Warehouse Access Rights Green <= 24 Hours, Yellow 24-48 hours, Red > 48 hours
 -
The Clarity Health portlet provides a quick glance into the health of key components and critical jobs in the Clarity environment. The following metrics are monitored: Process Engine Heartbeat should refresh itself every 10 minutes. Process Engine is responsible for the triggering of processes. Green <= 10 Minutes, Yellow 11-15 Minutes, Red > 15 Minutes Time Slices Time Slices are required for accurate reporting. Best practice is for the Time Slicing job to run every minute. Please note there are some jobs that will cause the time slicing to delay so a momentary delay is normal. Green <= 10 Minutes, Yellow 11-15 Minutes, Red > 15 Minutes Datamart Extraction Green <= 24 Hours, Yellow 24-48 hours, Red > 48 hours Datamart Rollup Green <= 24 Hours, Yellow 24-48 hours, Red > 48 hours Rate Matrix - Full Best practice is to run a full rate matrix nightly Green <= 24 Hours, Yellow 24-48 hours, Red > 48 hours Rate Matrix - Incremental Green <= 24 Hours, Yellow 24-48 hours, Red > 48 hours Load Data Warehouse - Full Load Green <= 24 Hours, Yellow 24-48 hours, Red > 48 hours Load Data Warehouse - Incremental Green <= 24 Hours, Yellow 24-48 hours, Red > 48 hours Load Data Warehouse Access Rights Green <= 24 Hours, Yellow 24-48 hours, Red > 48 hours
-
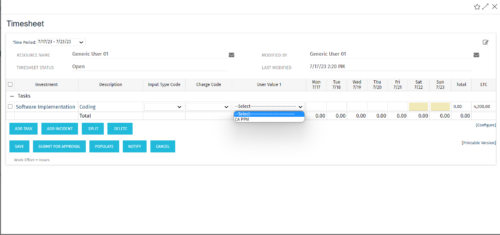 The tech-trick shows how to retrieve logged in User related values (ex: skill set) in timesheet.
 -
 This tech-trick defines how to run a Jaspersoft report using Rest API


Copyright 2023 • Rego Consulting Corporation • Privacy Policy