-
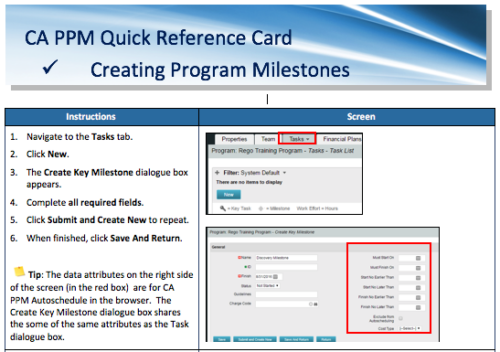 A Quick Reference Card to assist in the creation of Program Milestones in CA PPM. This can be done from the Tasks Tab or from the CA PPM Gantt.
 -
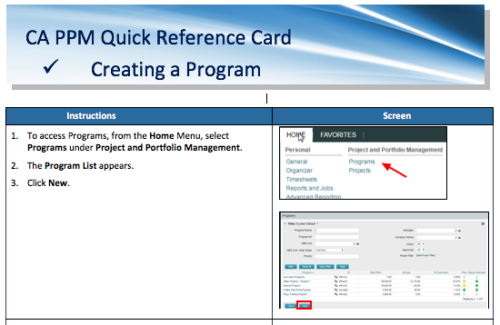 A Quick Reference Card to assist in the creation of a Program.
 -
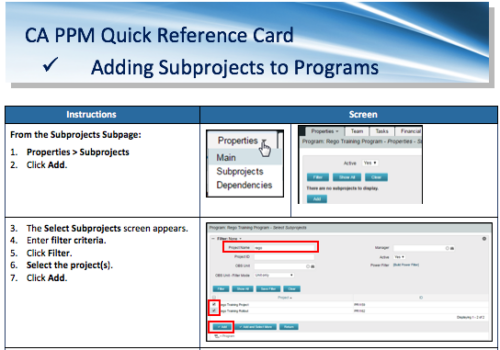 A Quick Reference Card to assist in the adding of Subprojects to Programs. Shows how add and remove from the Subprojects Subpage or from the Hierarchy Tab.
 -
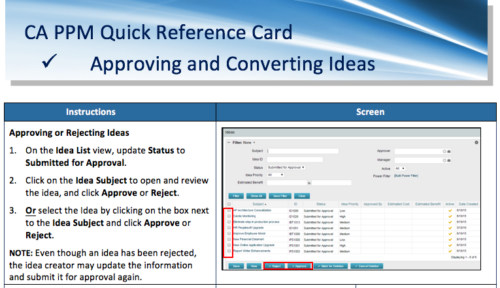 A Quick Reference Card to assist in the approving/rejecting of Ideas. Included converting Ideas once approved.
 -
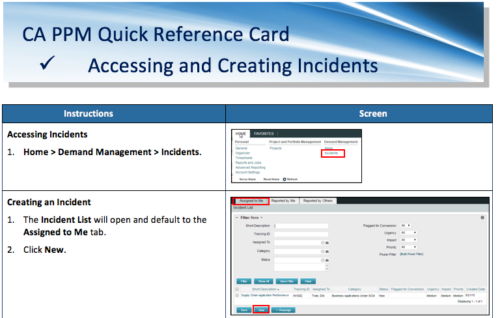 A Quick Reference Card to assist in the accessing and creation of Incidents in CA PPM. Incidents can be found by going to Home, then Demand Management to the Incident list menu item.
 -
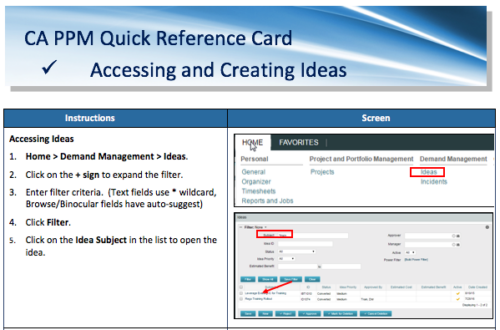 A Quick Reference Card to assist in the creation of Ideas in CA PPM. Ideas are created by going to Home, then Demand Management and choosing Ideas from the list menu.
 -
This course will provide an overview of CA PPM Demand Management functionality. Topics include: - What is Demand Management?
- Accessing and Creating Ideas
- Staffing the Idea Team
- Creating and Approving Idea Financial Plans
- Idea Conversion to another Investment Type
- Accessing and Creating Incidents
- Adding Incident Tasks to a Project
-
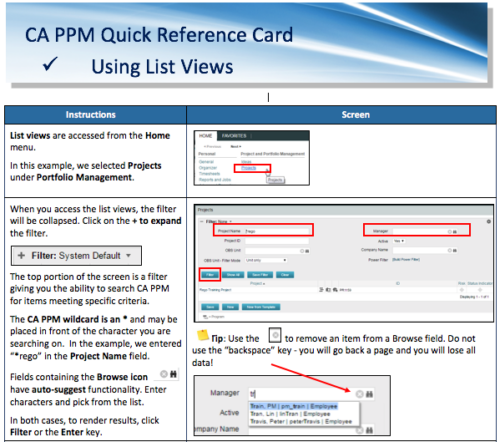 A Quick Reference Card to assist in the use of list views in CA PPM. List Views are accessed from the Home menu.
 -
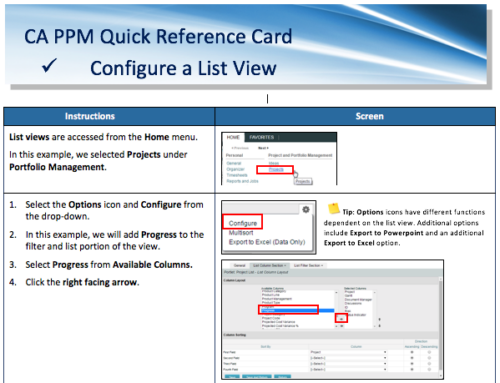 A Quick Reference Card for configuring List Views in CA PPM. List views are accessed from the Home menu.
 -
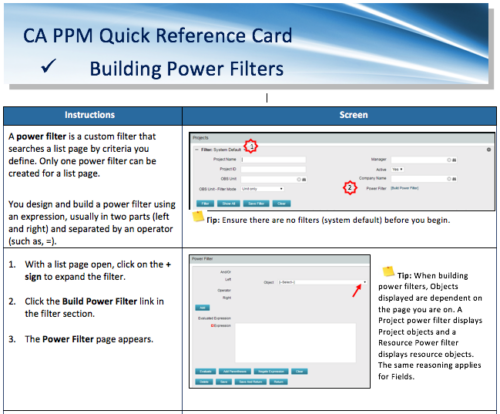 A Quick Reference Card to assist in the building of Power Filters in CA PPM. A power filter is a custom filter that searches a list page by criteria you define. Only one power filter can be created for a list page.
 -
 This video reviews the process of creating Timesheet Adjustments – making changes to a timesheet after it has been posted.
 -
 This video reviews how to return and approve Clarity timesheets as a Project or Resource Manager.


Copyright 2023 • Rego Consulting Corporation • Privacy Policy