-
 Course description: “Are some of your users leveraging a Smartsheet add-on for project planning, or are you looking for an alternative to OWB and MSP? Learn how this new scheduling tool is making waves and adding value for project managers working within CA PPM.” Download file is the presentation slidedeck.
 -
 Course description: “How do you close the feedback loop with your users? This session will review some innovative ways companies are connecting with CA PPM users to drive constant innovation and improve perception of the process and tool.” Download file is the presentation slide deck.
 -
 Course description: “Do CA PPM performance issues discourage your users? This class will review the root causes behind CA PPM performance problems and identify steps to improve performance, including specific recommendations and real case studies.”
 -
 Course description: “Does CA PPM Timeslice functionality seem like a foreign language to you? This intro to timeslices will cover an Overview of Timeslice Fundamentals, Terminology, Best Practices, Diagnostics, and the basic SQL Constructs to get you started.”
 -
 Course description: “Learn how to take advantage of the ad-hoc reporting capabilities of Jaspersoft, which comes embedded in CA PPM 14.2 and later. This class is designed to provide hands on exercises to teach individuals how to utilize the power of this new product. As users begin building their own reports and dashboards, the burden on developers will decrease and CA PPM perception and adoption will increase.” Download file is the presentation slide deck.
 -
 Course description: “Learn how to take advantage of the dashboard reporting capabilities of Jaspersoft, which comes embedded in CA PPM 14.2 and later. This class is designed to provide hands on exercises to teach individuals how to utilize the power of this Excelius-like capability. Leveraging the advanced UI features of dashboards, CA PPM perception will increase, giving executives the views they want.” Download file is the presentation slide deck.
 -
 Course description: “Already have a base understanding of Jaspersoft Studio development? This session will include advanced topics like: duplicating and modifying an OOTB report, Multiple Datasets, Subreports, Charting, Widgets integration, and Crosstabs.” Download file is the presentation slide deck.
 -
 Learn the basics of creating Jaspersoft studio reports. This session will walk through basic features and introduce report development utilizing the basic report capabilities of Jaspersoft Studio such as Text Fields, Frames, Static Text, Breaks, Lines and Common Page Information Components, Grouping/Sorting, Status Indicators, Dynamic Images, Input Controls, and Basic Charting.
 -
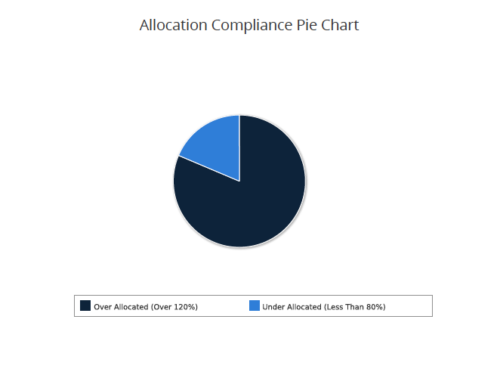 Allocation Compliance Pie Chart provides the resource manager a single place to view the Allocation compliance information in the form of a Pie chart. Allocation Compliance is calculated based on the value of 'Availability to Allocation Hours %'. Allocation Compliance is 'Under Allocated (Less Than 80%)' WHEN 'Availability to Allocation Hours %’ is less than 80. Allocation Compliance is 'Appropriately Allocated (Between 80-120%)' WHEN 'Availability to Allocation Hours %' is between 80 and 120. Allocation Compliance is 'Over Allocated (Over 120%)' WHEN 'Availability to Allocation Hours %' is greater than 120. User can further narrow their search by Resource Is Active?, OBS Type, OBS Path, Allocation Start Date, Investment Name and Resource Manager. User can use exact dates or relative dates for Allocation Start Date filter parameter.
 -
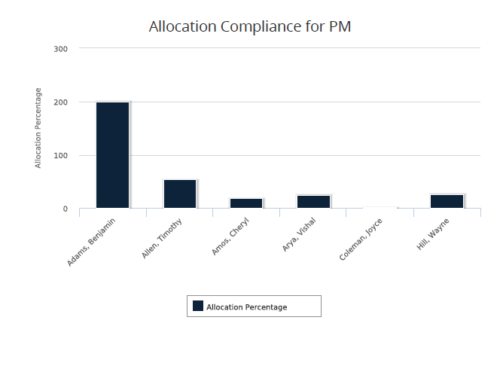 Allocation Compliance for PM report gives a view of resource Allocation percentage for active resources on the team of an investment for a selected Investment Manager. It allows the PM to see resources on their project over the coming months and whether they are over or under allocated. Allocation Percentage is calculated as (‘Allocated Hours’ / ‘Available Hours’) * 100. User can further narrow their search Month Start Date and Investment Manager. User can use exact dates or relative dates for Month Start Date filter parameter.
 -
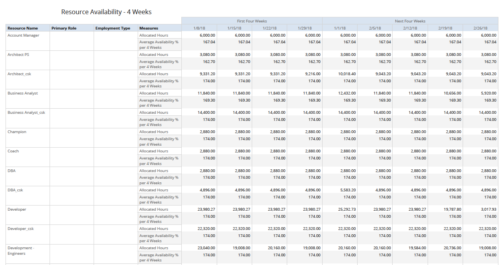 Resource Availability – 4 Weeks displays all resources with their total allocated hours by week, and an average availability percent (4 Wk Avail %) for next four weeks. This report also displays Resource Primary Role and Employment Type. User can further narrow their search by Resource Name, Resource Type & Week Start Date. User can use exact dates or relative dates for Week Start Date filter parameters.
 -
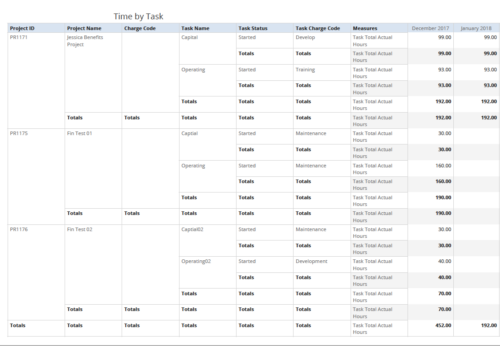 Time by Task report displays monthly time logged to Tasks for all filtered investments. It also displays total Actual hours associated with a task. User can further narrow their search by OBS Type & Path, Charge Code, Project Name, Task Name, Task Charge Code, Task Status and Month End Date. User can use exact dates or relative dates for Month End Date filter parameters.


Copyright 2023 • Rego Consulting Corporation • Privacy Policy