-
 A Quick Reference Guide to assist in the use of the Portfolio Reporting in Clarity’s Classic UX. Reviews the Scorecard in the Portfolio menu, portlet available, and exporting data as reports.
 -
 Learn how to create Custom Domains and Dashboards on the fly with Rego's Atul Kunkulol. This is a fun technique to use with your Demand and Capacity. Download is the slide deck file. To view the webinar click here - http://event.on24.com/wcc/r/1219157/B398371FAAAF960D6B26717D66F8011A
 -
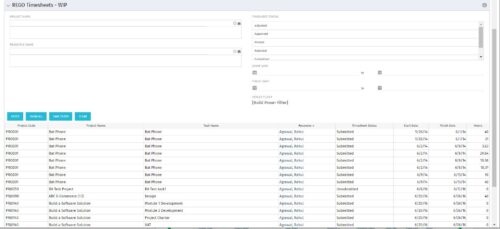 The REGO Timesheets - WIP portlet displays timesheet information for timesheets that have a status of posted but have not been posted to the WIP tables. This does not include records hung up in invalid transactions. Users can further narrow their search by Project Name, Resource Name, Timesheet Status, Start Date, and Finish Date.
 -
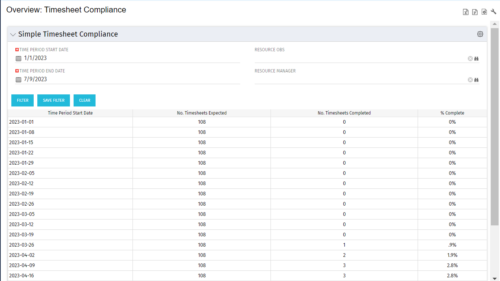 This portlet provides a view into the number of timesheets that were expected to be completed for a specified time period(s) as well as the number of timesheets that were completed and the percent complete. This can also be filtered by OBS so that a company can see timesheet compliance at the OBS level.
 -
 The tech-trick shows how to retrieve logged in User related values (ex: skill set) in timesheet.
 -
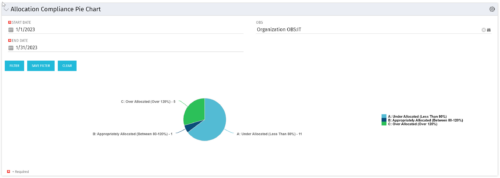 The Allocation Compliance Pie Chart portlet gives a view of active resources' allocation compliance within a date range and OBS displayed in a pie chart. It allows the user to the percentage of resources over, under, and adequately staffed on projects over a selected time period. This portlet leverages the daily allocation and daily availability slices as well as only active investments. The portlet provides filters for specific dates (required) and OBS.
 -


The Percent Time by Type and Timescale - Grid portlet shows a breakout of time by timescale for resources the logged in user has view rights for using the timeslices. This portlet gives the Clarity user the ability to show the amount of hours spent on a project by week, month, quarter and year. Using this portlet, the Clarity user can get an overview of all hours in a time period or use the filter to search for a specific dataset (as required). The portlet provides a filter for OBS and date ranges. -
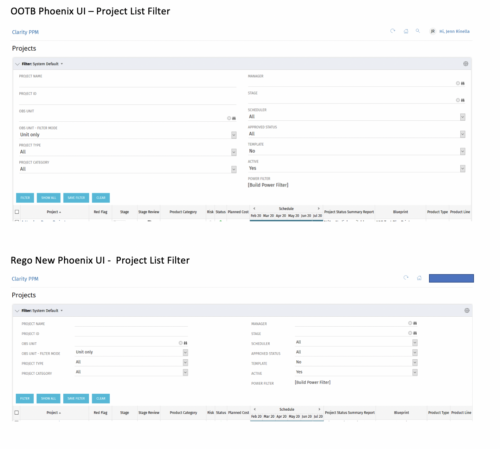
 Cleaner Phoenix UI Theme is very little padding and property sheet attributes are row based not column based.
 -
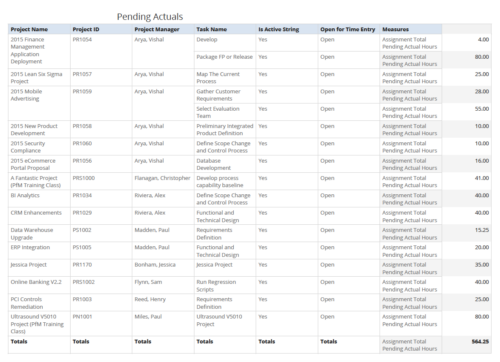 Pending Actuals report provides the Project Managers a single place to view all the pending actuals on tasks across multiple projects. User can view only the projects that he has access to. Managers can use this portlet to analyze the actuals that have been submitted but not posted on tasks. You can further narrow your search by OBS Type & Path and Assignment Total.
 -
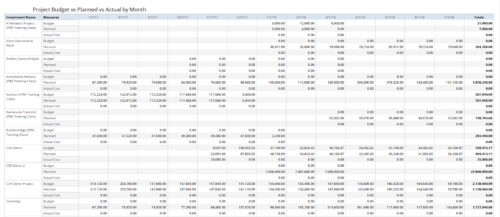 Project Budget vs Planned vs Actual by Month report provides the Project Managers a single place to view Project Budget, Planned and Actual Cost for multiple projects. Project Managers can use this view to compare various costs for that project in a particular month. User can further narrow their search by OBS Type & Path, Is Project Active?, Fiscal Month Start Date, Investment Manager and Investment Name.
 -
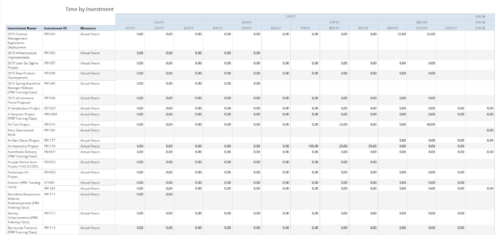 Time by Investment report displays time spent by resources on investment(s). User can view only the investments that he has access to view. Information can be drilled to Yearly, Quarterly or Monthly level. User can further narrow their search by OBS Type & Path, Investment Name, Month Start Date and Is Project Active?.


Copyright 2023 • Rego Consulting Corporation • Privacy Policy