-
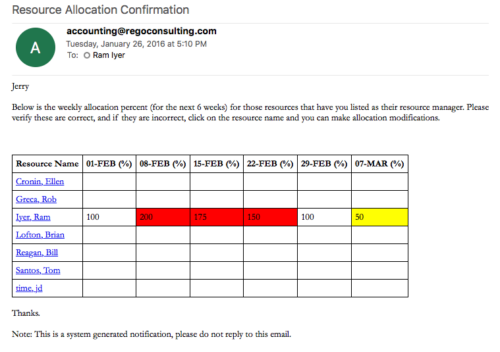 Process provides the RM with assigned resources availability percentage for the next four weeks. Grid displays all resources with their total allocated hours by week, and an average availability percent (4 Wk Avail %) for next four weeks. If % Available is negative, this indicates an over-allocation. Zero% Average Availability indicates fully allocated (no remaining availability). Links at the resource name allow for modifications by the RM.
 -
Process provides the RM with assigned resources availability percentage for the next four weeks. Grid displays all resources with their total allocated hours by week, and an average availability percent (4 Wk Avail %) for next four weeks. If % Available is negative, this indicates an over-allocation. Zero% Average Availability indicates fully allocated (no remaining availability). Links at the resource name allow for modifications by the RM.
-
 A .pdf file that has the slide by slide presentation at 2015 RegoU on enhancing CA PPM performance with a review of root causes and quick solutions.
 -
 A .pdf file that has the slide by slide presentation at 2015 RegoU on the elements of Financial Processing in CA PPM. The agenda covers a financial process overview, enabling time reporting, enabling financials, posting timesheets, transaction entries, posting to WIP, adjustments, importing financial actuals, and job scheduling.
 -
 A .pdf file that has the slide by slide presentation at 2015 RegoU on basic administration of CA PPM. The agenda covers an administration overview, objects, lookups, OBS/Security, portlets, processes, and support items.
 -
 A .pdf file that has the slide by slide presentation at 2015 RegoU on how other companies are using CA PPM. The agenda covers an overview, definitions, business value, key requirements and best practices.
 -
 Rego’s slide deck on the new features added to Clarity with the release of version 15.9.3. Covers the new features: general and use-ability, project management, roadmap/hierarchy, and resource/staffing.
 -
 The Financial Summary by Transaction Class provides a visual graph for each year’s financial picture for multiple years. Report contains the following items: KPIs: Displays total benefit, capital, expense and net cash flow for the selected filter criteria Grid: Displays year wise break up of benefit, capital, expense and net cash flow for the selected filter criteria Graph: Benefit, capital, expense and net cash flow are depicted in graphical way for multiple years. This report will show the user where they need to concentrate their efforts in order to meet financial commitments. User can further narrow their search by OBS Type & Path.
 -
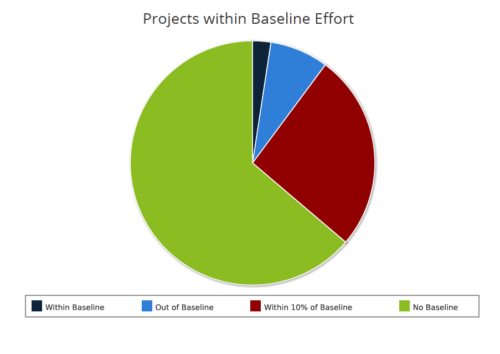 Projects within baseline effort report is a pie chart that displays projects baseline effort by their categories. Legend displays various baseline effort categories: Within Baseline, Out of Baseline, Within 10% Baseline and No Baseline. Mouse over on the pie chart displays the total number of projects within that particular category. You can further narrow your search by OBS Type & Path and Is Project Active?.


Copyright 2023 • Rego Consulting Corporation • Privacy Policy