-
 Have you ever experienced the downside of metrics? This class is a working session that review different types of metrics and the problems they uncover as well as the problems they can cause. Learn how to balance your positive and negative metric impacts.
 -
 Do you want to improve the success of your CA PPM projects? This class will discuss some lessons learned on making CA PPM projects more successful. We will discuss things like
- developing robust test plans, creating effective use and test cases, and implementing test scripts that make sense.
- why failures occur, and what you can do to minimize the impact and plan for success: case study in lessons learned.
- developing, testing, fine tuning, and executing deployment plans for success.
-
 Are you struggling with the best way to manage new CA PPM releases? In this class you’ll learn the best practice for testing, release cadence, prioritization, and migration to higher environments. We will review strong business cases and discuss roles and process.
 -
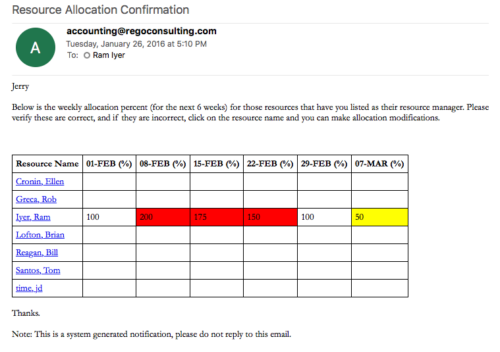 Process provides the RM with assigned resources availability percentage for the next four weeks. Grid displays all resources with their total allocated hours by week, and an average availability percent (4 Wk Avail %) for next four weeks. If % Available is negative, this indicates an over-allocation. Zero% Average Availability indicates fully allocated (no remaining availability). Links at the resource name allow for modifications by the RM.
 -
Process provides the RM with assigned resources availability percentage for the next four weeks. Grid displays all resources with their total allocated hours by week, and an average availability percent (4 Wk Avail %) for next four weeks. If % Available is negative, this indicates an over-allocation. Zero% Average Availability indicates fully allocated (no remaining availability). Links at the resource name allow for modifications by the RM.
-
 A .pdf file that has the slide by slide presentation at 2015 RegoU on enhancing CA PPM performance with a review of root causes and quick solutions.
 -
 A .pdf file that has the slide by slide presentation at 2015 RegoU on the elements of Financial Processing in CA PPM. The agenda covers a financial process overview, enabling time reporting, enabling financials, posting timesheets, transaction entries, posting to WIP, adjustments, importing financial actuals, and job scheduling.
 -
 A .pdf file that has the slide by slide presentation at 2015 RegoU on basic administration of CA PPM. The agenda covers an administration overview, objects, lookups, OBS/Security, portlets, processes, and support items.
 -
 A .pdf file that has the slide by slide presentation at 2015 RegoU on how other companies are using CA PPM. The agenda covers an overview, definitions, business value, key requirements and best practices.


Copyright 2023 • Rego Consulting Corporation • Privacy Policy