-
 The All Assignments portlet displays resource assignments across multiple projects. Currently, assignment information displayed for the project, in OWB, or MSP is limited to a single project. This portlet will provide a single view of the assigned data for all assignments across multiple projects. The portlet displays project actuals and estimates from the project (datamart tables). The Days Late field is calculated by the baseline date, while the Days Old field is calculated by today's date. Note: Only the projects that the user has viewer rights to will show up in the list. Filters provide the PM, RM, and individual resource the ability to monitor work progress across multiple projects. For example: ~ PMs can filter for all assignments that were to be completed by a given date but still have "Started" or "Not Started" status. ~ If multiple projects are utilizing the same resource, the PM or RM can filter for assignments utilizing that specific resource to prevent over-utilization. ~ A resource may filter for all assignments assigned to them, providing a picture of their total body of work.
 -
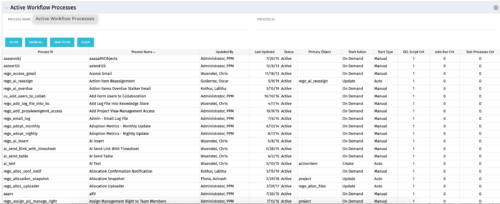 The Active Workflow Processes allows you to view all of the workflow processes within the system. It shows information about the process: the objects related, the start type, and if the process has sub-processes, jobs, or GEL scripts. This portlet is used by admins to determine how many processes are currently running in the system and on which objects. It will also display the start action, how many GEL scripts reside in the process, the run count and how many the sub-processes each process has. This information is helpful during upgrades and other testing.
 -
The Active Workflow Processes allows you to view all of the workflow processes within the system. It shows information about the process: the objects related, the start type, and if the process has sub-processes, jobs, or GEL scripts. This portlet is used by admins to determine how many processes are currently running in the system and on which objects. It will also display the start action, how many GEL scripts reside in the process, the run count and how many the sub-processes each process has. This information is helpful during upgrades and other testing.
-
The All Assignments portlet displays resource assignments across multiple projects. Currently, assignment information displayed for the project, in OWB, or MSP is limited to a single project. This portlet will provide a single view of the assigned data for all assignments across multiple projects. The portlet displays project actuals and estimates from the project (datamart tables). The Days Late field is calculated by the baseline date, while the Days Old field is calculated by today's date. Note: Only the projects that the user has viewer rights to will show up in the list. Filters provide the PM, RM, and individual resource the ability to monitor work progress across multiple projects. For example: ~ PMs can filter for all assignments that were to be completed by a given date but still have "Started" or "Not Started" status. ~ If multiple projects are utilizing the same resource, the PM or RM can filter for assignments utilizing that specific resource to prevent over-utilization. ~ A resource may filter for all assignments assigned to them, providing a picture of their total body of work.
-
 The Timesheet Detail report provides a detailed view of timesheet entries for each resource within a selected time period. It includes hours logged against tasks, other work, incidents, and indirect activities, displayed by day and in total. The report also captures any notes associated with each time entry, offering visibility into how time is allocated across different work types.
 -
 The Resource Time Review by Manager report provides visibility into timesheet entries for each resource, organized by investment manager or resource manager. It details hours entered by day and in total for each investment and time entry, helping managers monitor time allocation and utilization across their teams. This report supports effective oversight of resource effort and project participation.
 -
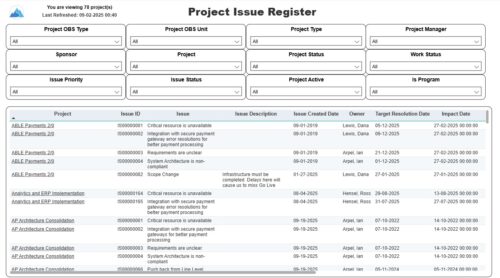 The Project Issue Register report displays comprehensive information for each project issue. The issue register also provides the option to display items that are associated to the issue such as notes, action items, and tasks. Report Prerequisites Verify that you have completed the following prerequisites before you run this report: • The project must have at least one issue for the project to display in the report. • The issue properties must have fields such as description, category, resolution, target resolution, impact date, and originating ID completed for them to display data in the report. The issue name, issue ID, priority, status, and owner are required in Classic PPM so they always display data.
 -
 Join us for a round table discussion on advanced SQL. We'll discuss sub-queries, common table expressions (CTE's), analytic functions, and any other requested topics. With multiple instructors we can break out into smaller groups for a more targeted experience.
 -
 This beginner-friendly course will cover basic administration within Modern UX. You'll learn about enabling MUX, establishing your System Settings, and Blueprints basics.
 -
 This course will focus on the financial setup and processing in Clarity. We'll discuss topics such as financial entities, fiscal periods, financial attributes, and how they all tie back to a labor rate matrix. These components are crucial for calculating labor costs within Clarity and enabling project managers to make financially sound decisions.
 -
 Aligning work to organizational strategy is a fundamental requirement in today's ever-changing marketplace. High performing organizations are moving beyond basic connections to introduce strategic hierarchies that are tied to real measurements of business value via Clarity's Objectives and Key Results (OKRs). Join our expert guides as they present key concepts, best practices, and the evolution of strategic alignment.
 -
 Value Stream Management (VSM) isn’t just another buzzword; it’s the visibility layer your digital transformation is starving for. In this session, learn how to map, measure, and maximize value across the entire delivery lifecycle.


Copyright 2023 • Rego Consulting Corporation • Privacy Policy