-
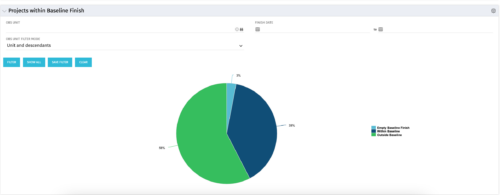 The Projects Within Baseline Finish portlet displays all projects that have a baseline and presents them in a pie chart. This portlet provides management with a way to quickly view the number of projects that are on time. The user may filter by OBS and finish date.
 -
The Projects Within Baseline Finish portlet displays all projects that have a baseline and presents them in a pie chart. This portlet provides management with a way to quickly view the number of projects that are on time. The user may filter by OBS and finish date.
-
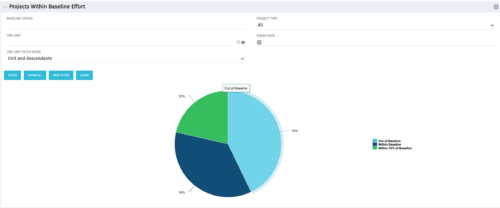
 Projects within baseline effort report is a pie chart that displays projects baseline effort by their categories. Legend displays various baseline effort categories: Within Baseline, Out of Baseline, Within 10% Baseline and No Baseline. Mouse over on the pie chart displays the total number of projects within that particular category. You can further narrow your search by OBS Type & Path and Is Project Active?.
 -
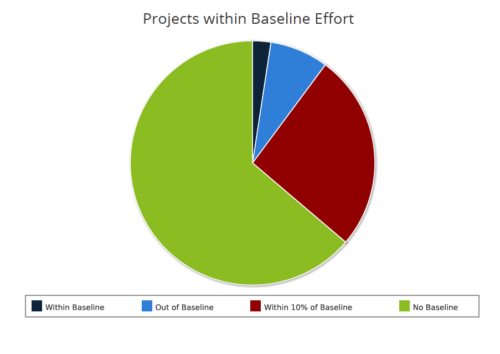
 The Projects Within Baseline Effort portlet will display all projects’ baseline effort in a pie chart by three different categories: Out of Baseline, Within Baseline, and Within 10% of Baseline. This portlet is used by the PMO to provide management with a snapshot of all projects and their baselines.
 -
The Projects Within Baseline Effort portlet will display all projects’ baseline effort in a pie chart by three different categories: Out of Baseline, Within Baseline, and Within 10% of Baseline. This portlet is used by the PMO to provide management with a snapshot of all projects and their baselines.
-
 The movement from managing technology organizations and development by Products instead of Projects has grown in recent years. This has many advantages, but only if there are critical changes in defining and funding the development. First, we shift from defining specific solutions to developing and defining the outcomes we want to accomplish with that development. Second, we should rethink how we fund development. Instead of funding a specific scope of work, we should fund the capacity to develop products.
 -
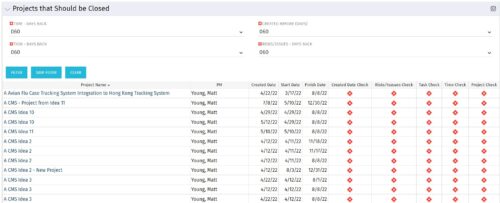
The Projects That Should Be Closed portlet displays all projects that have been created before the specified filter date and has had no new time, tasks, or risks/issues updated after the dates specified in the filter. This can assist in identifying projects that are completed or cancelled and should be closed. The table below describes the available columns in the portlet. Column Label Description Project Name Name of the project PM Manager of the project Created Date Created Date of the project Start Start Date of the project Finish Finish Date of the project Created Date Check Identifies if the project meets the Created Before (Days) filter Risks/Issues Check Identifies if the project meets the Risk/Issues – Days Back filter Task Check Identifies if the project meets the Task – Days Back filter Time Check Identifies if the project meets the Time – Days Back filter Project Check Identifies if the project meets the portlet filter Criteria id Internal code used by the query -
The Projects That Should Be Closed portlet displays all projects that have been created before the specified filter date and has had no new time, tasks, or risks/issues updated after the dates specified in the filter. This can assist in identifying projects that are completed or cancelled and should be closed. The table below describes the available columns in the portlet. Column Label Description Project Name Name of the project PM Manager of the project Created Date Created Date of the project Start Start Date of the project Finish Finish Date of the project Created Date Check Identifies if the project meets the Created Before (Days) filter Risks/Issues Check Identifies if the project meets the Risk/Issues – Days Back filter Task Check Identifies if the project meets the Task – Days Back filter Time Check Identifies if the project meets the Time – Days Back filter Project Check Identifies if the project meets the portlet filter Criteria id Internal code used by the query -
The Projects That Should Be Closed portlet displays all projects that have been created before the specified filter date and has had no new time, tasks, or risks/issues updated after the dates specified in the filter. This can assist in identifying projects that are completed or cancelled and should be closed. The table below describes the available columns in the portlet. Column Label Description Project Name Name of the project PM Manager of the project Created Date Created Date of the project Start Start Date of the project Finish Finish Date of the project Created Date Check Identifies if the project meets the Created Before (Days) filter Risks/Issues Check Identifies if the project meets the Risk/Issues – Days Back filter Task Check Identifies if the project meets the Task – Days Back filter Time Check Identifies if the project meets the Time – Days Back filter Project Check Identifies if the project meets the portlet filter Criteria id Internal code used by the query -
 The Projects Marked for Deletion portlet displays information about projects that are currently pending deletion but excludes templates and programs. This portlet provides an easy way to view all projects that are marked for deletion before the background job actually erases them. The portlet provides all necessary information as well as the project manager in case there are questions about why the project was marked for deletion.
 -
The Projects Marked for Deletion portlet displays information about projects that are currently pending deletion but excludes templates and programs. This portlet provides an easy way to view all projects that are marked for deletion before the background job actually erases them. The portlet provides all necessary information as well as the project manager in case there are questions about why the project was marked for deletion.
-
The Projects Marked for Deletion portlet displays information about projects that are currently pending deletion but excludes templates and programs. This portlet provides an easy way to view all projects that are marked for deletion before the background job actually erases them. The portlet provides all necessary information as well as the project manager in case there are questions about why the project was marked for deletion.


Copyright 2023 • Rego Consulting Corporation • Privacy Policy