-
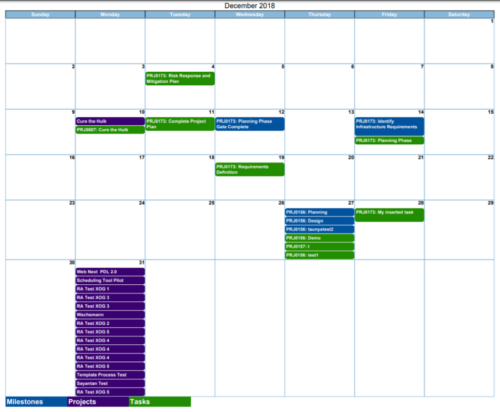
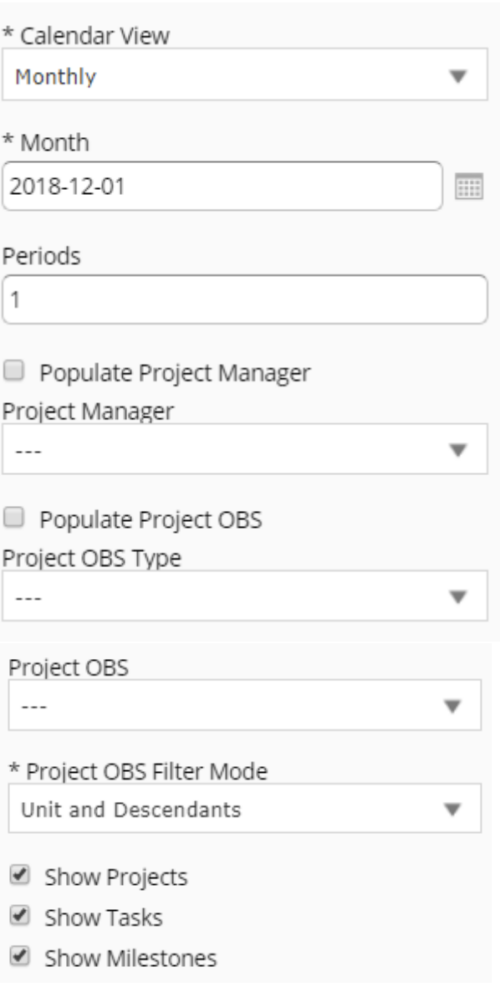 Calendar View report provides a view of Projects, Milestones or Tasks that has finish date within the user selected month. User has the flexibility to choose to Calendar view as Monthly or Weekly and also number of periods that needs to be displayed in the report. Report can be filtered to show only Projects or Milestones or Tasks with the checkboxes provided. It can also be further filtered using Project Manager and Project OBS parameters.
 -
 This portlet shows the project costs by Month. The information displayed includes:
- Start Date for project
- End Date for project
- Budgeted Cost
- Planned Cost
- Actual Hours
-
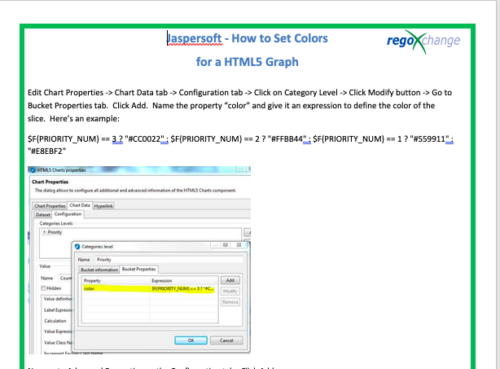 This tech-trick details the steps to set colors for an HTML5 Graph.
 -
 This configuration and accompanying process allows users to capture Financial and Non-Financial (Metrics, Soft, etc.) Benefit in a custom sub-object, then programmatically create an out-of-the-box Benefit Plan with just the Financial Portion from the custom sub-object. The solution is comprised of:
- Sub-Object (Benefit Plan Details, Parent = Project)
- Process: Create Benefit Plan (uses sub-object as primary input, native BP is output)
- Process: Update sql - Cost Benefit Plans (one-time script to update Projects)
- Ensure on the Benefit Details List view the Planned and Realized Amounts are displayed
- Modifying the Create Benefit Plan Process in support of a BP naming convention consistent with local PMO Practices
- Modifying the Create Benefit Plan Process to link the BP to the Cost Plan of Record
- Creating a Portlet that pulls together rows of data from the sub-object across multiple projects in a summarized view as well as a detailed view
-
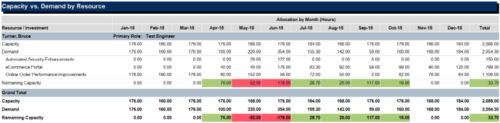
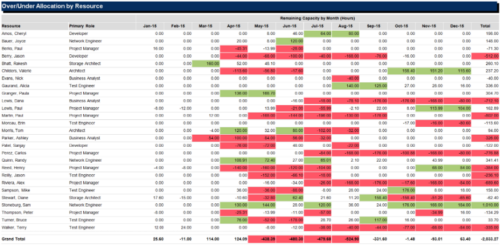 The Over/Under Allocation by Resource report is a transaction based Jaspersoft report that does not require the Load Jaspersoft Datawarehouse job to be run. The report will pull real-time data from the transaction tables in Clarity. This report can be run from either the Advanced Reporting or Reports and Jobs area within Clarity. The Over/Under Allocation by Resource report displays resource remaining capacity amounts by resource. The report displays amounts by week or month, and in total. The amounts can be displayed as hours or FTEs.
 -
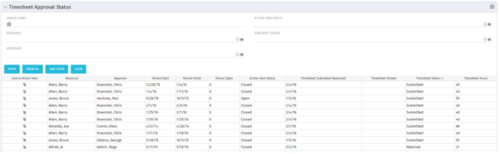 Portlet to show the stage of any Action Item triggered by Timesheet submission. Portlet allows for a period start date input, filters by Resource, Approver, Action Item Status and Timesheet Status. A link to the action item is provided for direct action by review if needed. This portlet is only for the clients who have established a process that triggers on Timesheet Status change to Submitted and to send Action Items to the person responsible for timesheet approval/validation i.e. PM for project tracking and/or RM for overall approval of the timesheet. The portlet won’t display any data if there are no timesheet Action Items. Examples of such processes would be CA’s OOTB Project Manager Approval or the Timesheet Approval - PM and RM process found on RegoXchange.
 -
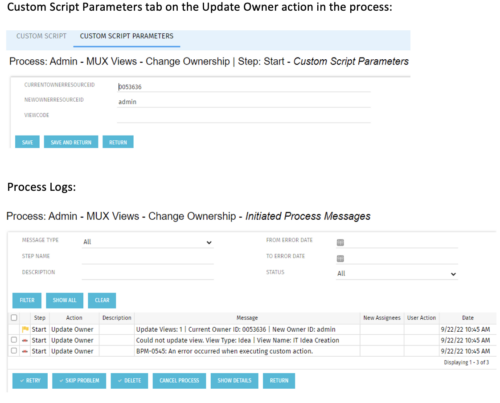 This is a standalone process that can be run by an admin to change the ownership of MUX views from a specified user to another specified user. The process contains a single custom script, which has the following parameters that must be updated prior to running the process:
- currentOwnerId (required): Resource ID for the current Owner (unique_name from srm_resources table)
- newOwnerId (required): Resource ID for the new Owner (unique_name from srm_resources table)
- viewCode (optional): Code for the specific view to update - leave blank if you want to transfer ownership for all views (odf_ui_views.code)
- Navigate to the process called Admin - MUX Views - Change Ownership.
- Navigate to the Start Step tab, Click on the Update Owner action, and click the Custom Script Parameters tab.
- Enter the Resource ID for the current view owner into the currentOwnerId parameter.
- Enter the Resource ID for the new owner into the newOwnerId parameter.
- If you want to update a specific view only, enter that in the viewCode parameter.
- Run the process via Organizer in Classic.
-
 A Quick Reference Guide to assist in managing a Custom Investment in Clarity’s Modern UX. Reviews accessing the Custom Investment Link and navigating the tabs.
 -
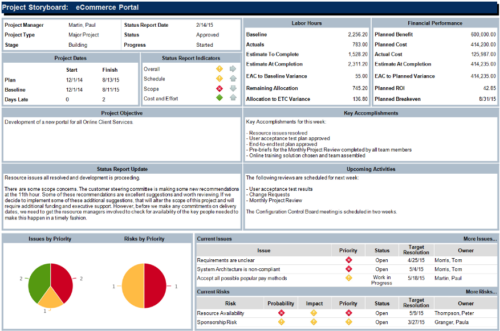 The Project Storyboard report is a transaction based Jaspersoft report that does not require the Load Jaspersoft Datawarehouse job to be run. The report will pull real-time data from the transaction tables in Clarity. This report can be run from either the Advanced Reporting or Reports and Jobs area within Clarity. The Project Storyboard report shows key aspects of a project that is organized in separate frames. Each frame in the report displays project information such as project dates, project objective, the amount, and cost of resources that are planned and actual, key accomplishments, upcoming activities, current issues and risks, and the project progress toward goals. This report can be used to analyze the project earned value and track work performance to account for cost and schedule variances.
 -
 Over time notifications can build up in the CA PPM system and should be purged, so as not to hinder performance. The SQL statements mentioned in the tech doc can be implemented within a process in CA PPM to either purge notifications on an ongoing basis or remove all of them at once.
 -
 JasperSoft as two font databases – one for display and one for pdf exporting. Not all fonts in the display database are in the exporting database. If you find you are not getting the proper fonts when exporting to PDF from JasperSoft this tech trick will show you how to add the missing font so your report exports as expected.
 -
 This portlet pulls back the Availability and Allocation totals by Role between a user-specified Start and Finish Date, then the user can drilldown to look at the information for Applications. The Time Period filter allows for comparing these values across different timeframes (monthly, weekly, quarterly, annual) as desired. Other filters allow for looking at Active or Inactive Roles (or both) and including Active or Inactive Projects (or both) in the totals.


Copyright 2023 • Rego Consulting Corporation • Privacy Policy