-
 A Quick Reference Guide to assist in the process of adding filtering for the data to be presented in a Jaspersoft Report. If a report output contains more information than desired, Jaspersoft Reporting provides an interactive filtering capability so only the necessary data is displayed. The filtering conditions can include fields, numbers, dates and text. Filters can be added to reports as they are being created or adding to saved views. Filters cannot be added to a Report.
 -
 XOG & Query Bridge (XQ) is a 2-in-1 Clarity PPM toolset that provides enhanced functionality and an improved user experience when retrieving and inserting data to/from Clarity PPM environments. XQ is available as a Web-based application and also as a downloadable desktop version that supports both On-premise and On-demand Clarity PPM implementations. https://xogbridge.com/
 -
 A Quick Reference Guide with tips on creating a Dashboard in Jaspersoft. The document walks through the steps and uses screenshots to show the process.
 -
 A Quick Reference Guide to assist in the process of creating a chart in Jaspersoft. The guide walks through the steps using screenshots.
 -
 A Quick Reference Guide to assist in the process of creating a crosstab in a Jaspersoft Ad-hoc report. The document uses screenshots to walk you through the process.
 -
 A Quick Reference Guide to assist in the process of creating a table in a Jaspersoft Ad-Hoc Report. Uses screenshots to walk you through the process.
 -
 A Quick Reference Guide to assist in the process of scheduling a Jaspersoft Report to run. Gives you the steps and shows screen shots to assist with the process.
 -
 A Quick Reference Guide to assist in the process of running a Jaspersoft Report. Guide walks through the steps and has screen shots to assist in the process.
 -
 An updated version of our training material for Jaspersoft Ad-Hoc Reporting for Clarity. Introduces Jaspersoft as a reporting tool, explains security, the data warehouse, and JS Domains. Then delves into navigation, running a report, creating an ad-hoc report, saving it, creating a cross tab report, creating a chart, creating a dashboard, and scheduling the report.
 -
 A Quick Reference Guide to assist in managing a Custom Investment in Clarity’s Modern UX. Reviews accessing the Custom Investment Link and navigating the tabs.
 -
 A Quick Reference Guide on setting up Custom Investments in Clarity’s Modern UX. Reviews setting up the Custom Investment, and creating Custom Investment Records.
 -
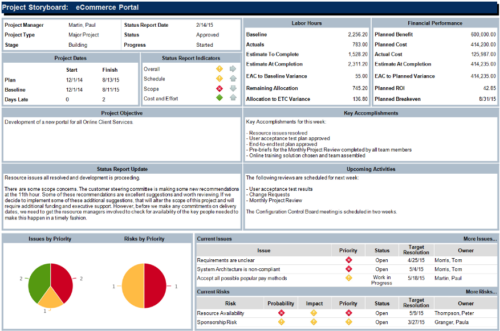 The Project Storyboard report is a transaction based Jaspersoft report that does not require the Load Jaspersoft Datawarehouse job to be run. The report will pull real-time data from the transaction tables in Clarity. This report can be run from either the Advanced Reporting or Reports and Jobs area within Clarity. The Project Storyboard report shows key aspects of a project that is organized in separate frames. Each frame in the report displays project information such as project dates, project objective, the amount, and cost of resources that are planned and actual, key accomplishments, upcoming activities, current issues and risks, and the project progress toward goals. This report can be used to analyze the project earned value and track work performance to account for cost and schedule variances.


Copyright 2023 • Rego Consulting Corporation • Privacy Policy