- Projects with 0 change requests
- Projects with 1 change request
- Projects with 2-5 change requests
- Projects with 5-10 change requests
- Projects with over 10 change requests
-

 The portlet, Project Change Request Count Pie with drill-down is a simple pie that displays the total count of projects in the pie. The slices are:
 -

 The portlet, Project Change Request Count Pie with drill-down is a simple pie that displays the total count of projects in the pie. The slices are:
- Projects with 0 change requests
- Projects with 1 change request
- Projects with 2-5 change requests
- Projects with 5-10 change requests
- Projects with over 10 change requests
-

 The portlet, Project Change Request Count Pie with drill-down is a simple pie that displays the total count of projects in the pie. The slices are:
- Projects with 0 change requests
- Projects with 1 change request
- Projects with 2-5 change requests
- Projects with 5-10 change requests
- Projects with over 10 change requests
-
 The Project Close Process workflow process aides the Project Manager in some routine close out tasks that accompany every project. Marking the project inactive starts the process and it will continue down one of two paths:
- Once the project is inactive, the process will then check to see if there is no remaining estimate to complete (ETC) still on the project. If there is ETC leftover, then the process will go into a waiting state for 14 days to allow the project manager to cleanup or to cancel the process if it was done in error. After 14 days, the process will check to see if the project is active. If the project is active, then the process will end. However, if the project is still inactive, the process will continue with the closeout activities even if there is ETC still on the project.
- If the project is marked inactive after the initial 14 days of waiting if applicable, then the process will immediately move to the closeout activities.
- Turning off time entry for the project, tasks and project members
- Updates the ETC, proposed ETC, and pending estimates to 0
- Updates the task status and assignment status to Completed
- Sets the task, assignment and project finish dates to today’s date only if the finish dates are after the process run date
- Sets all Risks and Issues to Closed with a resolution of “## This was closed automatically as part of the project close process ##”
- Set future hard allocation and allocation finish dates to today when the date is after today’s date
-
 The Project Close Process workflow process aides the Project Manager in some routine close out tasks that accompany every project. Marking the project inactive starts the process and it will continue down one of two paths:
- Once the project is inactive, the process will then check to see if there is no remaining estimate to complete (ETC) still on the project. If there is ETC leftover, then the process will go into a waiting state for 14 days to allow the project manager to cleanup or to cancel the process if it was done in error. After 14 days, the process will check to see if the project is active. If the project is active, then the process will end. However, if the project is still inactive, the process will continue with the closeout activities even if there is ETC still on the project.
- If the project is marked inactive after the initial 14 days of waiting if applicable, then the process will immediately move to the closeout activities.
- Turning off time entry for the project, tasks and project members
- Updates the ETC, proposed ETC, and pending estimates to 0
- Updates the task status and assignment status to Completed
- Sets the task, assignment and project finish dates to today’s date only if the finish dates are after the process run date
- Sets all Risks and Issues to Closed with a resolution of “## This was closed automatically as part of the project close process ##”
- Set future hard allocation and allocation finish dates to today when the date is after today’s date
-
 The Project Close Process workflow process aides the Project Manager in some routine close out tasks that accompany every project. Marking the project inactive starts the process and it will continue down one of two paths:
- Once the project is inactive, the process will then check to see if there is no remaining estimate to complete (ETC) still on the project. If there is ETC leftover, then the process will go into a waiting state for 14 days to allow the project manager to cleanup or to cancel the process if it was done in error. After 14 days, the process will check to see if the project is active. If the project is active, then the process will end. However, if the project is still inactive, the process will continue with the closeout activities even if there is ETC still on the project.
- If the project is marked inactive after the initial 14 days of waiting if applicable, then the process will immediately move to the closeout activities.
- Turning off time entry for the project, tasks and project members
- Updates the ETC, proposed ETC, and pending estimates to 0
- Updates the task status and assignment status to Completed
- Sets the task, assignment and project finish dates to today’s date only if the finish dates are after the process run date
- Sets all Risks and Issues to Closed with a resolution of “## This was closed automatically as part of the project close process ##”
- Set future hard allocation and allocation finish dates to today when the date is after today’s date
-
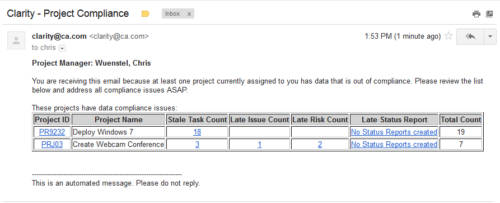 The Project Compliance Stalker – PM sends an email to Project Managers (and also their managers if so desired) at a set interval to alert them to project compliance issues. Areas of compliance that are reviewed include: stale project tasks (stale = past due date), late issues and risks (past due date) and late status reports.
 -
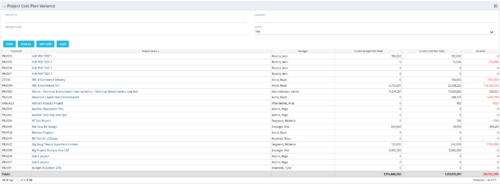 The Project Cost Plan Variance displays the variance between the budget and cost plans for projects the logged in user has security rights to view. The total for the Cost Plan that is marked as the Plan of Record for the project (Current Cost Plan Total), alongside the total for the current approved Budget Plan (Current Budget Plan Total). These two values are then compared in order to generate the total current Variance for the project. A positive amount in the Variance column indicates the project is under budget, while a negative amount indicates the project is over budget. Results may be filtered by: Project ID, Project Name, Manager, and whether the project is Active (Yes, No, All). By default, the portlet will display only Active projects.
 -
 The Project Cost Plan Variance displays the variance between the budget and cost plans for projects the logged in user has security rights to view. The total for the Cost Plan that is marked as the Plan of Record for the project (Current Cost Plan Total), alongside the total for the current approved Budget Plan (Current Budget Plan Total). These two values are then compared in order to generate the total current Variance for the project. A positive amount in the Variance column indicates the project is under budget, while a negative amount indicates the project is over budget. Results may be filtered by: Project ID, Project Name, Manager, and whether the project is Active (Yes, No, All). By default, the portlet will display only Active projects.
 -
 The Project Cost Plan Variance displays the variance between the budget and cost plans for projects the logged in user has security rights to view. The total for the Cost Plan that is marked as the Plan of Record for the project (Current Cost Plan Total), alongside the total for the current approved Budget Plan (Current Budget Plan Total). These two values are then compared in order to generate the total current Variance for the project. A positive amount in the Variance column indicates the project is under budget, while a negative amount indicates the project is over budget. Results may be filtered by: Project ID, Project Name, Manager, and whether the project is Active (Yes, No, All). By default, the portlet will display only Active projects.
 -
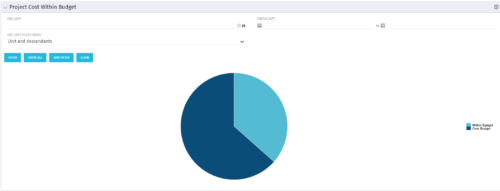
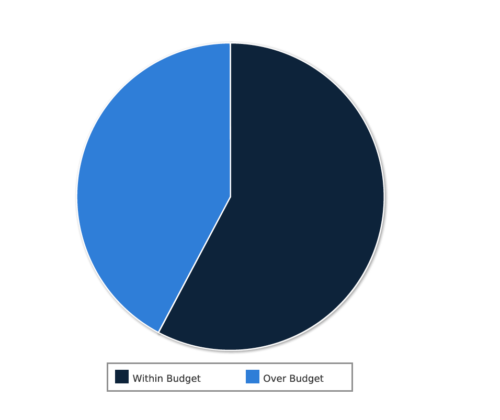 Project Cost within Budget report displays count of projects that are within or exceeding budget in the form of a pie chart. This report provides management a graphical representation of cost status on all projects. Mouse over on the pie chart displays count of projects for that category. You can further narrow your search by OBS Type & Path, Project Manager, Project Status, Project Stage, Program Name, Is project Active? And Is Template?.
 -
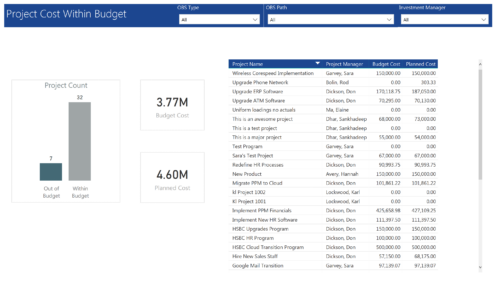 Project Cost within Budget report displays count of projects that are within or exceeding budget in the form of a bar chart. It also displays Total budget cost and Planned cost. User can further drill down the details to investment level. You can further narrow your search by OBS Type & Path and Investment Manager.
 -
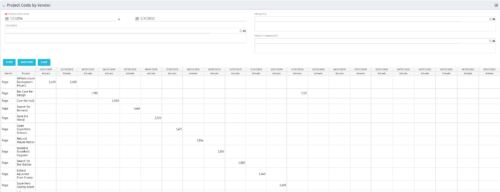
 The portlet shows the project spend to vendors by month. The Vendor field picked on the portlet comes from the Vendor mentioned when creating the voucher (as displayed on the first screenshot). This provides a nice view of identifying how much is spent by an organization on the vendor employees on their workforce.
 -

 The portlet shows the project spend to vendors by month. The Vendor field picked on the portlet comes from the Vendor mentioned when creating the voucher (as displayed on the first screenshot). This provides a nice view of identifying how much is spent by an organization on the vendor employees on their workforce.
 -

 The portlet shows the project spend to vendors by month. The Vendor field picked on the portlet comes from the Vendor mentioned when creating the voucher (as displayed on the first screenshot). This provides a nice view of identifying how much is spent by an organization on the vendor employees on their workforce.
 -
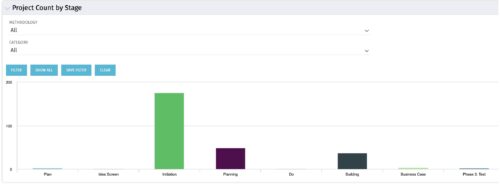
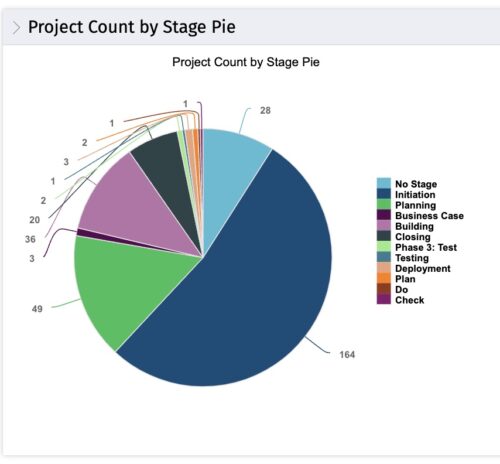 This portlet displays the projects by Stage in a pie chart. Every piece of the pie chart represents a stage of the Project Management methodology applied. The portlet also shows the number of projects on each stage. The legend displays all the different project stages appearing on the portlet. This portlet can be filtered to show only projects from a particular OBS unit or for a particular Project Manager.

