
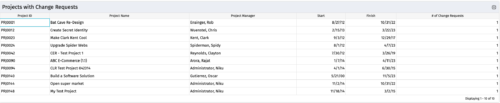
- Projects with 0 change requests
- Projects with 1 change request
- Projects with 2-5 change requests
- Projects with 5-10 change requests
- Projects with over 10 change requests
-
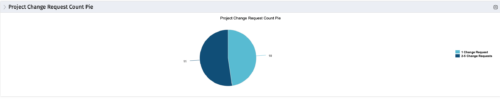 The portlet, Project Change Request Count Pie with drill-down is a simple pie that displays the total count of projects in the pie. The slices are:
 -
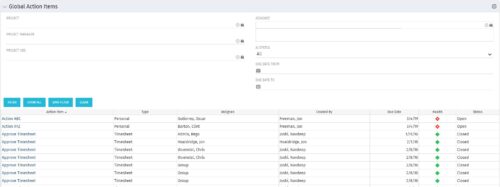 The Global Action Items portlet will help users and clarity admins to keep track of action items in the CA PPM system. This is useful to keep track of Timesheet Approval through Action Item or any other Action Item related workflows. The portlet displays Name, Type Assignee, Created by, Due Date, Health and Status of the Action Items as default columns. The portlet provides Project, Project Manager, Project OBS, Assignee, Status and Due Dates of the Action Items as default filters.
 -
The Global Action Items portlet will help users and clarity admins to keep track of action items in the CA PPM system. This is useful to keep track of Timesheet Approval through Action Item or any other Action Item related workflows. The portlet displays Name, Type Assignee, Created by, Due Date, Health and Status of the Action Items as default columns. The portlet provides Project, Project Manager, Project OBS, Assignee, Status and Due Dates of the Action Items as default filters.
-
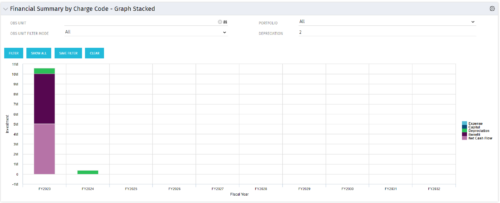 The Financial Summary by Charge Code – Graph Stacked portlet displays yearly charge code financial information across all projects in a stacked bar graph. This portlet provides management with a snapshot of all projects’ financial information totaled and sorted by expense, capital, depreciation, benefit, and net cash flow. The depreciation is calculated based on a straight-line method. The user may filter on OBS unit and/or portfolio to narrow down the search results.
 -
The Financial Summary by Charge Code – Graph Stacked portlet displays yearly charge code financial information across all projects in a stacked bar graph. This portlet provides management with a snapshot of all projects’ financial information totaled and sorted by expense, capital, depreciation, benefit, and net cash flow. The depreciation is calculated based on a straight-line method. The user may filter on OBS unit and/or portfolio to narrow down the search results.
-
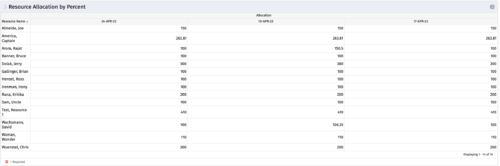 This portlet shows resource allocation by percent and hours, and gives ability to filter on allocation percent. The RM can use the portlet to see if any of the resources is over/ under allocated.
 -
This portlet shows resource allocation by percent and hours, and gives ability to filter on allocation percent. The RM can use the portlet to see if any of the resources is over/ under allocated.
-
This portlet shows resource allocation by percent and hours, and gives ability to filter on allocation percent. The RM can use the portlet to see if any of the resources is over/ under allocated.
-
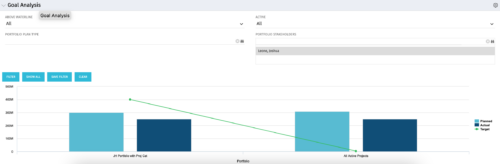 Part of our Business Transformation collection, this portlet relates exclusively to Benefit costs in the Portfolio and its investments. Portlet is a combination of Line Chart and Vertical Bar Charts. It displays data for one or more portfolios depending on rights and filters. Green Line represents Portfolio Target Benefits. Light blue bar represents aggregation of investment Planned Benefits. Dark blue bar represents aggregation of Investment Realized Benefits (actual benefits). Filtering is available for Above or Below Waterline investments OR all portfolio Investments. May also filter on Portfolio values as well as Plan values. Filtering also available for Active vs Inactive Portfolios.
 -
Part of our Business Transformation collection, this portlet relates exclusively to Benefit costs in the Portfolio and its investments. Portlet is a combination of Line Chart and Vertical Bar Charts. It displays data for one or more portfolios depending on rights and filters. Green Line represents Portfolio Target Benefits. Light blue bar represents aggregation of investment Planned Benefits. Dark blue bar represents aggregation of Investment Realized Benefits (actual benefits). Filtering is available for Above or Below Waterline investments OR all portfolio Investments. May also filter on Portfolio values as well as Plan values. Filtering also available for Active vs Inactive Portfolios.
