-
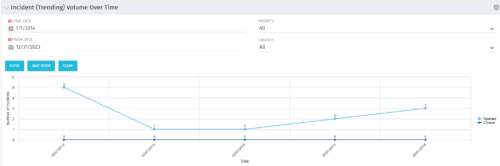 This view depicts trends of created and resolved Incidents over time, grouped by month. The count of incidents opened is determined by the Created Date of the Incident, and the count of Incidents closed is determined by the Resolution Date of the Incident. The view is filterable by Priority and Urgency as well as a date range. NOTE: The values returned are the total sum for a given month, not a cumulative total over time.
 -
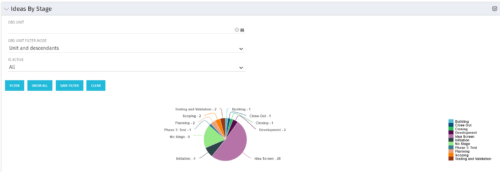 Pie Chart displays count of all Ideas by stage. Filterable by Active and Inactive, and also by OBS. Data label and mouse-over show Stage counts. Legend displays Stage names. This portlet assumes the use of the custom Stage attribute on Idea object.
 -
Pie Chart displays count of all Ideas by stage. Filterable by Active and Inactive, and also by OBS. Data label and mouse-over show Stage counts. Legend displays Stage names. This portlet assumes the use of the custom Stage attribute on Idea object.
-
Pie Chart displays count of all Ideas by stage. Filterable by Active and Inactive, and also by OBS. Data label and mouse-over show Stage counts. Legend displays Stage names. This portlet assumes the use of the custom Stage attribute on Idea object.
-
 Pie Chart displays count of all Ideas by Department. Filterable by Active and Inactive, by OBS, and by Department Manager. Data label and mouse-over show department counts. Legend displays department names.
 -
Pie Chart displays count of all Ideas by Department. Filterable by Active and Inactive, by OBS, and by Department Manager. Data label and mouse-over show department counts. Legend displays department names.
-
Pie Chart displays count of all Ideas by Department. Filterable by Active and Inactive, by OBS, and by Department Manager. Data label and mouse-over show department counts. Legend displays department names.
-
 Pie Chart displays total Ideas by Priority, filterable by Active / Inactive and by OBS structure. Data Label and Mouse-over label display counts by Priority. Legend shows Priority Name. Chart also shows Ideas with No Priority.
 -
Pie Chart displays total Ideas by Priority, filterable by Active / Inactive and by OBS structure. Data Label and Mouse-over label display counts by Priority. Legend shows Priority Name. Chart also shows Ideas with No Priority.
-
Pie Chart displays total Ideas by Priority, filterable by Active / Inactive and by OBS structure. Data Label and Mouse-over label display counts by Priority. Legend shows Priority Name. Chart also shows Ideas with No Priority.
-
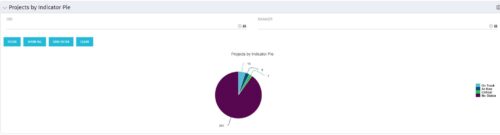
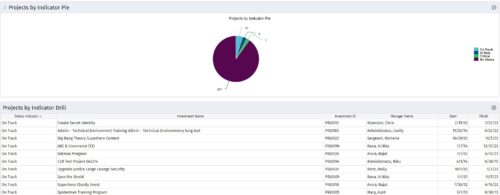 Pie Chart displays counts of all projects by out-of-box Status Indicator attribute. Filterable by OBS structure and Manager. Data label displays count. Mouse-over and Legend display Indicator name. Chart also displays count for projects with no Indicator. By clicking on a pie slice, a grid portlet appears displaying all projects with that indicator value.
 -
Pie Chart displays counts of all projects by out-of-box Status Indicator attribute. Filterable by OBS structure and Manager. Data label displays count. Mouse-over and Legend display Indicator name. Chart also displays count for projects with no Indicator. By clicking on a pie slice, a grid portlet appears displaying all projects with that indicator value.


Copyright 2023 • Rego Consulting Corporation • Privacy Policy