-
 This training document is a Rego Consulting Quick Reference Guide to assist resource managers with the adjusting of timesheets. This doc references version 16.4 views. Document provides guidance on how to use the Review & Approve tab to adjust time that has already been entered by a resource.
 -
 This training document is a Rego Consulting Quick Reference Guide to assist with Entering and Submitting Time in Clarity’s Modern User Experience. This doc references version 16.4 views. Document includes Accessing & Selecting Timesheets, Populate Timesheet, Updating Timesheet, Submitting Timesheet and Entering Time for Someone Else.
 -
 This training document is a Rego Consulting Quick Reference Guide to assist with the creation and use of Widgets in Clarity’s Modern User Experience. It covers the 5 types: Number Tile, Pie, Bar, Progress Ring, and Target. This doc references version 16.4 views.
 -
 This training document is a Rego Consulting Quick Reference Guide to assist with the utilization of some of the most common components in Clarity’s Modern User Experience. This doc references version 16.4 views. Document includes content on Grid View, View Options, Adjust Columns, Details Panel, Group By, Save Views and Manage Views.
 -
 This training document is a Rego Consulting Quick Reference Guide to assist with the utilization of Tasks and To Do’s in Clarity’s Modern User Experience. This doc references version 16.4 views. Document references the Tasks and To Do’s menu items and their associated widgets.
 -
 This training document is a Rego Consulting Quick Reference Guide to assist with the utilization of the My Workspace area within Clarity’s Modern User Experience. This doc references version 16.4 views. Document reviews Checklists, Smartlists and To Do’s.
 -
 This training document is a Rego Consulting Quick Reference Guide to assist with General Navigation in Clarity’s Modern User Experience. This doc references version 16.4 views. Doc reviews the Menu Bar and User Tool Bar.
 -
 This training document is a Rego Consulting Quick Reference Guide to assist with the basic navigation and use of common components in Clarity. We review Key Terms and Definitions, User Profile, User Settings, Workspaces, Filters and Grid Layout. This doc references version 16.4 views.
 -
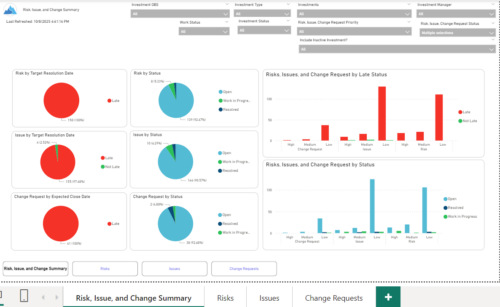 The Investment Risk, Issue, and Change Summary report delivers a consolidated view of overall project health through analytical visualization of risks, issues, and change requests. The report incorporates interactive pie chart representations to monitor item distribution by target resolution date, expected closure date, and current status, enabling efficient trend analysis and decision-making. A detailed transactional data table provides comprehensive visibility into each record, including item name, unique identifier, priority, status, category, ownership, creation date, and projected or actual resolution/closure dates. Additionally, the report supports dynamic grouping by project or ungrouped analysis, allowing stakeholders to perform flexible cross-project monitoring, operational tracking, and performance assessment.
 -
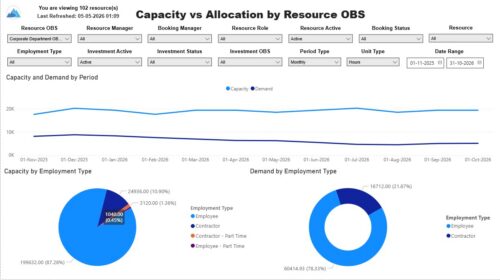 The Capacity vs. Allocation by OBS report displays resource capacity and demand across investments. The report can be grouped by any OBS level, providing visibility into resources at any level of the organization. The report displays amounts by week or month, and in total. The amounts can be displayed as hours or FTEs. Report Prerequisites Verify that you have completed the following prerequisites before you run this report: • Resource capacity amounts display if the resource has availability that is defined and meets the parameter criteria. • Resource demand allocation amounts display if the resource is allocated to at least one investment. Resource assignments are not required. • The Load Data Warehouse job must be run before you run this report. If the Data Warehouse is not populated, the report will not display any data. Also, most of the report parameters do not display options.
 -
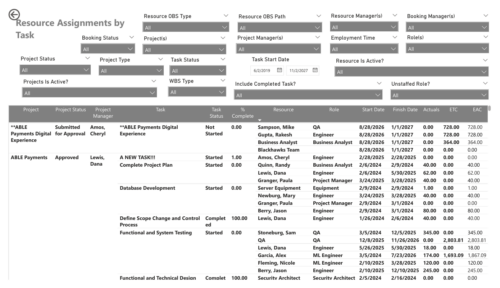 The Resource Assignments by Task report delivers a detailed view of effort distribution for resources working on investment tasks. It outlines both recorded and projected effort at the task assignment level, along with total effort per resource. In addition, the report includes key task details such as progress status, percentage of completion, and assignment start and end dates. This information helps stakeholders monitor workload distribution, track task progress, and evaluate how resource effort aligns with project expectations.
 -
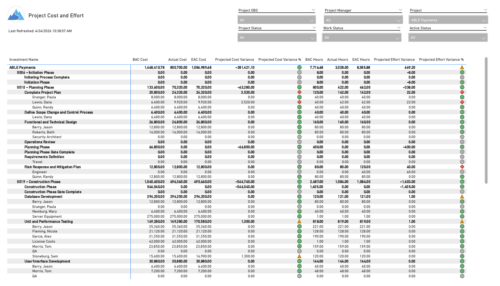 The Project Cost and Effort report provides a structured view of project financials and effort by outlining the work breakdown hierarchy, including any related subprojects. Users can choose to display information at varying levels of detail, such as project, phase, task, or assignment, depending on reporting needs. The report includes key metrics like baseline values, actuals, estimates at completion, and projected variances for both cost and effort. This enables stakeholders to analyze performance, monitor spending and workload, and gain insight into how projects are tracking against expectations.


Copyright 2023 • Rego Consulting Corporation • Privacy Policy