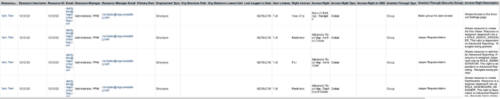
RegoXchange
  • Part of the Business Transformation Package, this portlet displays the portfolios with hierarchy (child portfolio(s)). The portlet displays the basic portfolio fields like – manager, stakeholder, etc. A Metrics subpage can be created with the fields on the “Properties – Metrics.”.   The fields: Overall Health, Goal Alignment, Innovation Level, Probability of Success are custom fields and can be configured on a subpage.
  • Part of the Business Transformation Package, this portlet displays the portfolios with hierarchy (child portfolio(s)). The portlet displays the basic portfolio fields like – manager, stakeholder, etc. A Metrics subpage can be created with the fields on the “Properties – Metrics.”.   The fields: Overall Health, Goal Alignment, Innovation Level, Probability of Success are custom fields and can be configured on a subpage.
  • Part of the Business Transformation Package, this portlet displays the portfolios with hierarchy (child portfolio(s)). The portlet displays the basic portfolio fields like – manager, stakeholder, etc. A Metrics subpage can be created with the fields on the “Properties – Metrics.”.   The fields: Overall Health, Goal Alignment, Innovation Level, Probability of Success are custom fields and can be configured on a subpage.
  • This portlet shows the project costs by Month. The information displayed includes:
    • Start Date for project
    • End Date for project
    • Budgeted Cost
    • Planned Cost
    • Actual Hours
    This provides the PM with a one shot view of the total financials/actuals for the project. The Project name field is linked to the project properties page. In case of any adjustments, the PM can toggle b/w the portlet and the project with ease.  The user can filter on multiple projects, or projects by OBS, or by PMs, to view the data on the portlet.
  • Part of the Business Transformation collection, this pie chart portlet displays realized benefit, grouped by category for portfolio investments. It uses System Provider: Portfolio Investment Provider.
  • Part of the Business Transformation collection, this pie chart portlet displays realized benefit, grouped by category for portfolio investments. It uses System Provider: Portfolio Investment Provider.
  • Part of the Business Transformation collection, this pie chart portlet displays realized benefit, grouped by category for portfolio investments. It uses System Provider: Portfolio Investment Provider.
  • This tech-trick details the steps to set colors for an HTML5 Graph.
  • You can now directly query your CA PPM SaaS database without the need for VPN. Utilize the open source SQL client SQuirreL to write read-only queries (up to 1000 rows) against the database.
  • This configuration and accompanying process allows users to capture Financial and Non-Financial (Metrics, Soft, etc.) Benefit in a custom sub-object, then programmatically create an out-of-the-box Benefit Plan with just the Financial Portion from the custom sub-object.  The solution is comprised of:
    • Sub-Object (Benefit Plan Details, Parent = Project)
    • Process: Create Benefit Plan (uses sub-object as primary input, native BP is output)
    • Process: Update sql - Cost Benefit Plans (one-time script to update Projects)
    The Process to create the Benefit Plan is initiated when users check the Create Benefit Plan box on the sub-object.  Every time the Process runs it aggregates all rows from the sub-object that are flagged as Financial and creates a new Benefit Plan.  The resulting BP is not linked to any Cost Plans. Users who install this base solution will want to consider:
    • Ensure on the Benefit Details List view the Planned and Realized Amounts are displayed
    • Modifying the Create Benefit Plan Process in support of a BP naming convention consistent with local PMO Practices
    • Modifying the Create Benefit Plan Process to link the BP to the Cost Plan of Record
    • Creating a Portlet that pulls together rows of data from the sub-object across multiple projects in a summarized view as well as a detailed view
    Once installed, please refer to the Benefit Detail Functionality Document for how to create Benefit Detail records, initiate the process, and the Benefit Plan Creation.
Go to Top