| Installation files are not provided with the download. While the MUX Migration Tool is free, it does require some time by Rego Technical Staff to install. Approximately 4 hours is required. If you are current Rego Customer, this time can be applied against a current project if you choose, or against an Ad Hoc SOW/PO you have in place with us. Please reach out to your friendly Rego Account Director to arrange to have the tool installed. Installation files are not provided with this download. They will be installed by our staff.
If you are currently not a Rego client, we invite you to reach out to us at info@regoconsulting.com and we can arrange to set up an Ad Hoc bucket of hours for this install and any future work we can do for you. |
*Note: MUX Migrator v2.0 will only work on Clarity versions 16.1.0 and higher.
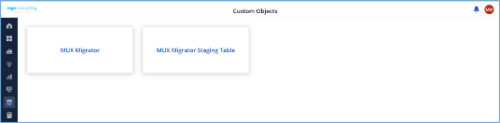
The Migration Tool for Modern UX Components provides the ability to migrate Blueprints, Views, and Field Level Security between environments. Previously, the promotion of these components needed to be done manually. This functionality, to be utilized by an administrator, is available under the Custom Objects Area of Clarity.
Source to Target Approach
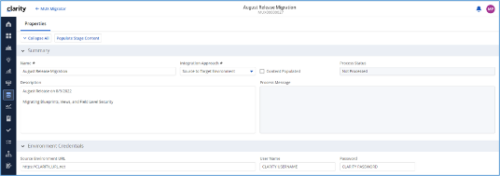
The user would first create an ‘MUX Migrator’ instance and populate the associated details. Once ready, they will use the “Populate Stage Content” action which will run a workflow in the background to populate a Staging Table with Source Environments content. (Blueprints, Views, and Field Level Security)
After a successful populate, they would navigate to the “MUX Configuration” module where they can decide on what content they want to migrate between environments. They can select one to many components they wish to migrate.
Once the “MUX Configuration” sub-object is populated, the user can navigate back to the “Properties” module. Once a password is populated, the user can use the Actions drop-down to run the “Migrate Content to Environment” workflow. This will run a process that will migrate the content from the source environment to the target environment.
JSON Approach
The user would first create an ‘MUX Migrator’ instance and populate the associated details. They would navigate to the “MUX Configuration” module where they can decide on what content they want to migrate between environments. They can select one to many components they wish to migrate.
Once the “MUX Configuration” sub-object is populated, the user can navigate back to the “Properties” module. The user can use the Actions drop-down to run the “Export JSON” workflow. This will run a process that will generate a .txt file located in the “JSON File” attribute. That file can be downloaded from the Source Environment. The user can then login to the Target Environment. The user would first create an ‘MUX Migrator’ instance and populate the associated details. Once the ‘MUX Migrator’ instance is created, they can upload the JSON File that was downloaded from the Source Environment. The user can use the Actions drop-down to run the “Import JSON” workflow. This will run a process that will generate read the file located in the “JSON File” attribute and load the configuration into the Target Environment.
View Administration
The user would first create an ‘MUX Migrator’ instance and populate the associated details. They would navigate to the “MUX View Administration” module where they can decide on what views they would like to update the creator of. They can also reset the “default” view displayed when logged in for a resource(s), Security Group(s), or Resource OBS Node(s).
Prerequisites
- The user will create the migrator instances/run the processes in the Target Environment they wish to migrate content to (E.g., Run this in PROD to migrate the content from a lower environment to PROD)
- Any attributes that are part of the Blueprints, Views, or Field Level Security must exist in the target environment.
- The user that is utilizing the content must have the following security rights associated to their account.
- XOG rights to all the associated objects
- View/edit security rights to the MUX Migrator Object and MUX Migrator Content Object
- oView rights to the MUX Migrator Staging Table Object
- API-Access
- Process Start or Process AutoStart – All
|
|

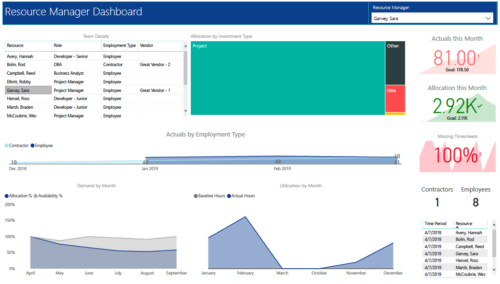 RM Dashboard shows various KPIs like Actuals posted by the resources in last month, Allocation in current month, count of missed timesheets etc. Team Details – Grid report providing list of all the resources managed by a resource manager. Allocation by Investment type – Tree graph displaying distribution pattern of allocation hours across different investment types. Actuals by Employment Type - Area graph, displaying actual hours posted by Employees Vs Contractors. Demand by Month – Area graph, displaying Allocation Vs Availability for next 6 months. Utilization by Month - Area graph, displaying Baseline Vs Actuals hours over last 6 months.
 A tech trick document that assists you in update Data Source when utilizing the Power BI reports found in RegoXchange.
 Learn basic administrative tasks in this basic administration Clarity training, which includes setting up resources, security groups, OBSs, lookups, time reporting periods, fiscal time periods, calendars, jobs, and timeslices. These activities are focused on ongoing support vs. new configuration. Learn how to setup the ModernUX
 Hierarchies and Roadmaps are two powerful capabilities that Clarity has brought to the market. While they work great independently, have you experimented with how they can work together, even better? In this session, come and learn how these two capabilities can complement each other by working in concert giving you both planning and execution insights!
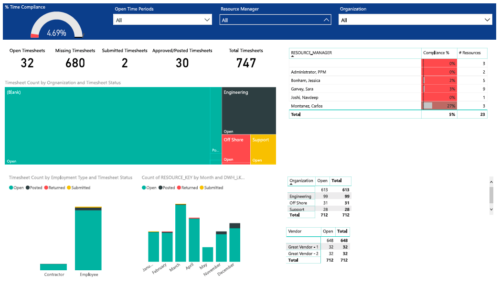 Timesheet compliance is a dashboard containing multiple visualizations that shows timesheet compliance data under various scenarios. Dashboard shows count of timesheets grouped by Status and total available timesheets. % Time Compliance – Gauge graph that shows percentage of completed timesheets against overall timesheets. Compliance by Resource Manager – Grid section that shows percent timesheet compliance by resource manager. Timesheet count by Employment type and Timesheet Status – Stacked column chart, each column represents Employment type and sections of the column represent count of timesheets by Status. Count of Timesheets by Months – Stacked column chart, each column represents a month and sections of the column represent count of timesheets by Status. Dashboard also const of two grid sections displaying number of Open timesheets by Organization and Vendor.
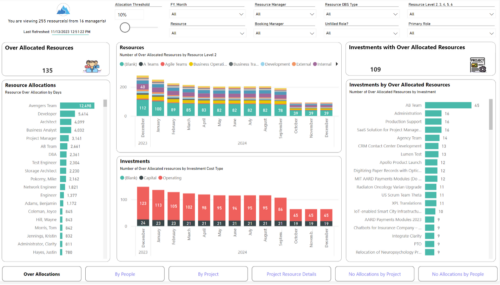 Evaluate resource allocations, identify bottlenecks, and ensure optimal resource utilization across projects and teams. Report Views include: • Over Allocation • By Project • By People • Project Resource Details • No Allocations by Project • No Allocations by People The main file will access data through custom queries created via Rego Odata connector.
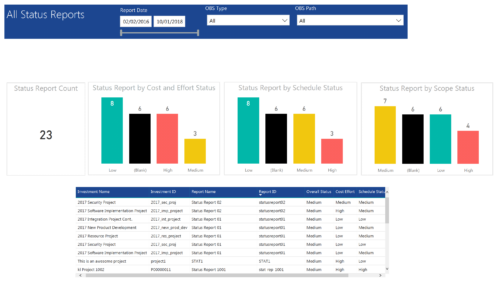 All Status report provides project managers a single place to view KPIs related to Status Reports. All the KPIs are depicted in various visualizations. Status Report Count: Scorecard that displays the # of Status Reports for the selected criteria. Status Report by Cost Effort Status: Column chart that displays # of Status Reports by Cost Effort. X axis displays various Cost Effort Status. Data labels indicate the number of Status Reports associated with that category. Status Report by Schedule Status: Column chart that displays # of Status Reports by Schedule Status. X axis displays various Schedule statuses. Data labels indicate the number of Status Reports associated with that status. Status Report by Scope Status: Column chart that displays # of Status Reports by Scope Status. X axis displays various Scope statuses. Data labels indicate the number of Status Reports associated with that status. Grid: Displays Status Report details such as Investment ID, Investment Name, Report Name, Report ID, Overall Status, Cost Effort, Schedule Status and Scope Status. You can further narrow your search by OBS Type, OBS Path and Report Date range
 Learn advanced administrative development tasks—including Objects and Fields, Object Portlets, Basic Processes, and XOG. In the last portion of this class we will walk through the high level data model within the Clarity database and walk through some basic NSQL portlets. This is a more technical class focusing on basic configurations - designed for non-technical people.
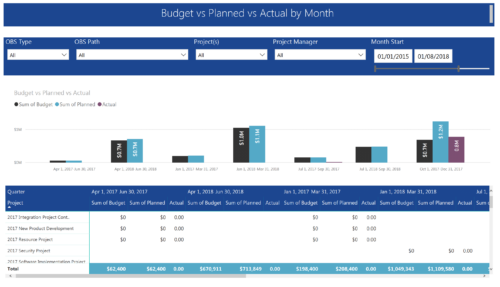 Project Budget vs Planned vs Actual by Month report provides the Project Managers a single place to view Project Budget, Planned and Actual Cost for multiple projects. This report displays Project Budget vs Planned vs Actual by Month in the form of clustered bar chart over a period of time. User can further drill down the information to investment level by selecting a particular bar within the chart. User can further narrow their search by OBS Type & Path, Project(s), Project Manager, Month Start and End Date.
 This training document is a Rego Consulting Quick Reference Guide to assist with accessing the various project views in Clarity’s Modern User Experience. Reviews the Tile, Grid and Board views for projects.
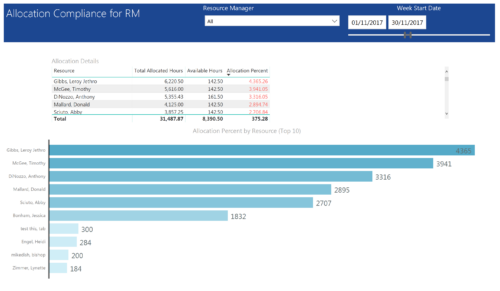 Allocation Compliance by RM report provides resource managers a single place to view Available hours, Allocation Hours and Allocation Percentage of Resources. It considers the resources of selected resource manager and it displays the following: Allocation Details Grid: Displays Resource and its Allocated hours, Available hours and Allocation percentage (Allocated hours/Available Hours) Allocation Percent by Resource: Bar chart that displays Allocation Percentage (top 10) for various resources during the selected Time frame. You can further narrow your search by Resource Manager & Month Start Date range.