The
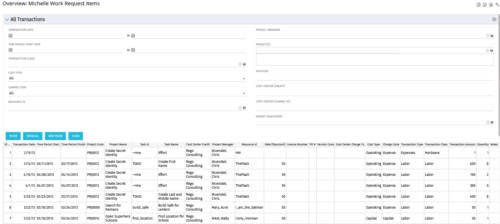
All Transactions portlets have the capability to display any transaction within the system. Transactions from any type of investment can be viewed on this page.
There are two version of this process:
- All Transactions (with security) – this will display rows only where the logged in resource has access to cost plans for projects or ideas. The portlet will check instance, OBS and global rights.
- All Transactions (without security) – will display all rows, regardless of cost plan access rights.
By default, there are numerous filter options displayed, such as transaction dates, transaction class and cost type.
The table below describes the available columns in the portlet.
| Column Label |
Description |
| ID |
An unique identifier for each row displayed in the portlet. |
| Transaction Date |
The data the transaction has been coded to. |
| Time Period Start |
For transactions arising from timesheet entries, this will show the start period of the timesheet. |
| Time Period Finish |
For transactions arising from timesheet entries, this will show the finish period of the timesheet. |
| Project Code |
The ID of the investment. |
| Project Name |
The name of the investment. |
| Task ID |
The ID of the investment task where the actual cost has been assigned. |
| Task Name |
The name of the investment task where the actual cost has been assigned. |
| Cost Center Credit |
The department assigned to the resource where a cost needs to be credited. |
| Project Manager |
The resource managing the investment. |
| Resource ID |
The ID for the resource that has been assigned the cost. |
| Rate (Standard) |
The rate for the cost. |
| Invoice Number |
The invoice number. May come from a manual transaction or may be imported from a financial system integration. |
| PO # |
The purchase order number. May come from a manual transaction or may be imported from a financial system integration. |
| Vendor Code |
The vendor code that has been listed against the transaction. |
| Cost Centre Charge To |
The department assigned to the resource where a cost needs to be charged. |
| Cost Type |
Indicates whether the transaction is capital or operating. |
| Charge Code |
The charge code assigned to the transaction as per the Clarity Charge Code list. |
| Transaction Type |
Labour, Expense, Equipment or Material. |
| Transaction Class |
The transaction class assigned to the transaction as per the Clarity transaction class list. |
| Transaction Amount |
Rate x Quantity. |
| Quantity |
The number of units. |
| Notes |
Free text field for the transaction. |
 This training document is a Rego Consulting Quick Reference Guide to assist with Entering and Submitting Time in Clarity’s Modern User Experience. This doc references version 16.1.2 views. Document includes Accessing & Selecting Timesheets, Populate Timesheet, Updating Timesheet, Submitting Timesheet and Entering Time for Someone Else.
 This training document is a Rego Consulting Quick Reference Guide to assist resource managers with the approval of timesheets via the Review & Approve tab. This doc references version 16.1.2 views. Doc reviews accessing and selecting timesheets, reviewing submitted timesheets, approving timesheets, approving multiple timesheets, returning timesheets and the timesheet grid.
 This training document is a Rego Consulting Quick Reference Guide to assist with Time Entry Administration Settings for Timesheets. This doc references version 16.1.2 views. Document provides detail on Timesheet Options for the Modern UX and how to enable end user column configuration. Detail is also provided on how end users may configure their timesheet view.
 This training document is a Rego Consulting Quick Reference Guide to assist with the utilization of some of the most common components in Clarity’s Modern User Experience. This doc references version 16.1.2 views. Document includes content on Grid View, View Options, Adjust Columns, Details Panel, Group By, Save Views and Manage Views.
 The All Transactions portlets have the capability to display any transaction within the system. Transactions from any type of investment can be viewed on this page. There are two version of this process:
