-
 A Quick Reference Guide to assist in the administrative process of updating an OBS in Clarity. An Organizational Breakdown Structure (OBS) is a hierarchical structure you can use to align resources, projects and investments. Note: the following steps apply when updating a non-financial OBS. The financial OBS (Department and Location OBS) are generally setup as part ofthe Clarity implementation.
 -
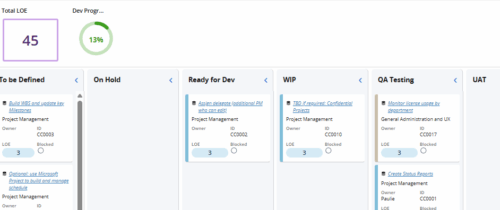
 A Quick Reference Guide to assist in the use of the Objectives Board View. The view options allow you to customize the Board layout. Options include Columns, Swimlanes, Color and Labels.
 -
 A Quick Reference Guide to assist in the creation of Objectives in Clarity. Clarity now has an out of the box module called objectives which can replace a custom objective module that was previously created and has default attributes for both Objectives and Key Results (sub-object).
 -
 A Quick Reference Guide to assist in the use of the Objectives Grid view. The Objective grid provides the ability to create new Objectives, filter, add fields to the gird, save and load views, export the list of hierarchies and review the details of an Objective.
 -
 A Quick Reference Guide to assist in setting up a login message that users can see whenever they log into Clarity. QRG walks through the configuration steps. Message Severity and duration can also be setup.
 -
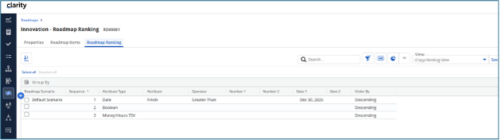
 The Rego Roadmap Ranking provides the ability to rank Roadmap Items within individual Roadmap Scenarios. The function allows the user to define a hierarchical sequence to defined attributes to create a set of rules to generate an auto-ranking, by scenario. Large sets of ranking rules increase complexity and variability, so choose initial rules carefully. When the rank order is configured, a process is actioned that auto-ranks the Roadmap Items for the selected Roadmap Scenario. The Roadmap Ranking can be viewed through the Timeline, Board, or Grid View.
 -
If you work in a busy Project Management Office (PMO), then you know that good quality data is paramount to effective planning, decision making, and project delivery. You also know that sometimes a single data point can be enhanced when it is supplemented by additional information. But as an administrator or part of the PMO, how can you guide team members to ensure they enter meaningful data into your project management system? Clarity now offers the capability to create business rules which can enforce data-entry based on the way that other attributes have been updated. In this article, you’ll get step-by-step instructions on how to update your Clarity blueprints to utilize the new Conditional Required Modal.
-
 Leverage a Kanban or Sprint approach to manage Clarity Implementation and ongoing improvements. List also serves as a history of configuration changes, reasons, and deployment dates.
 -
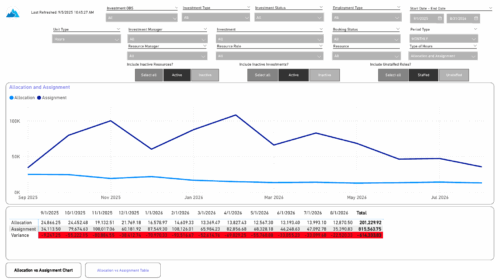 The Investment Allocations and Assignments report provides visibility into team member allocation, task assignment, and variance amounts by investment across time periods. A chart highlights allocation compared to assignment amounts by period. Results can be displayed by week, month, or in total, and viewed in either hours or FTEs for each team member and investment. Interactive visuals make it easy to compare planned effort against actual assignments at the team member and investment level. Content Type: Business Intelligence, PowerBI Report
 -
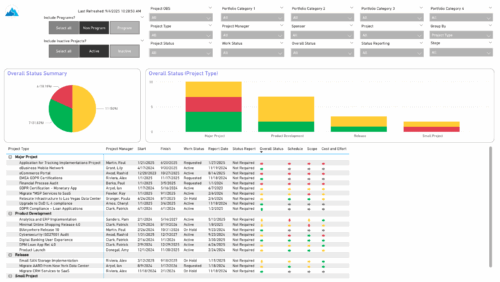 The Project Status Report List provides a consolidated view of project health, including schedule dates, work status, and key status indicators. Users can group results by Portfolio Category, Overall Status, Project Type, Stage, Project Manager, Sponsor, or OBS Level, with the report dynamically adjusting its columns based on the grouping selected. Visuals include an overall status pie chart that shows the percentage of projects by status color, and a column chart that breaks down project counts by status, aligned to the chosen grouping option.
 -
 Hear from existing Clarity customers as they share what's working well in their implementations. Gain insights from these real-world success stories. This deck is from Day 1 of the Client Presentations.
 -
 Hear from existing Clarity customers as they share what's working well in their implementations. Gain insights from these real-world success stories. This deck is from Day 2 of the presentations.


Copyright 2023 • Rego Consulting Corporation • Privacy Policy