-
 Part of the Business Transformation collection, this line chart portlet displays realized vs planned benefits overtime, for portfolio investments. This provides the PfM with a holistic view of benefits planned vs realized over a period of time.
 -
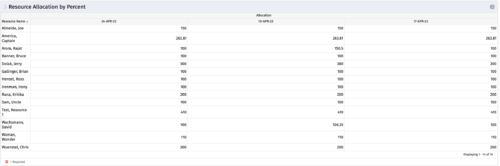 This portlet shows resource allocation by percent and hours, and gives ability to filter on allocation percent. The RM can use the portlet to see if any of the resources is over/ under allocated.
 -
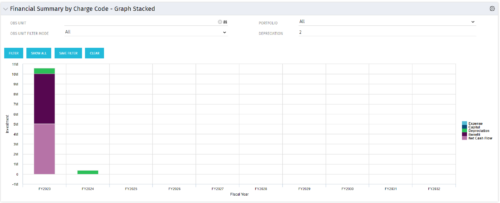 The Financial Summary by Charge Code – Graph Stacked portlet displays yearly charge code financial information across all projects in a stacked bar graph. This portlet provides management with a snapshot of all projects’ financial information totaled and sorted by expense, capital, depreciation, benefit, and net cash flow. The depreciation is calculated based on a straight-line method. The user may filter on OBS unit and/or portfolio to narrow down the search results.
 -
The Financial Summary by Charge Code – Graph Stacked portlet displays yearly charge code financial information across all projects in a stacked bar graph. This portlet provides management with a snapshot of all projects’ financial information totaled and sorted by expense, capital, depreciation, benefit, and net cash flow. The depreciation is calculated based on a straight-line method. The user may filter on OBS unit and/or portfolio to narrow down the search results.
-
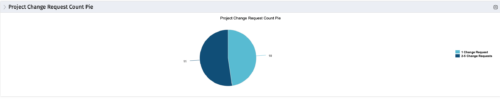 The portlet, Project Change Request Count Pie with drill-down is a simple pie that displays the total count of projects in the pie. The slices are:
- Projects with 0 change requests
- Projects with 1 change request
- Projects with 2-5 change requests
- Projects with 5-10 change requests
- Projects with over 10 change requests
-
The portlet, Project Change Request Count Pie with drill-down is a simple pie that displays the total count of projects in the pie. The slices are:
- Projects with 0 change requests
- Projects with 1 change request
- Projects with 2-5 change requests
- Projects with 5-10 change requests
- Projects with over 10 change requests
-
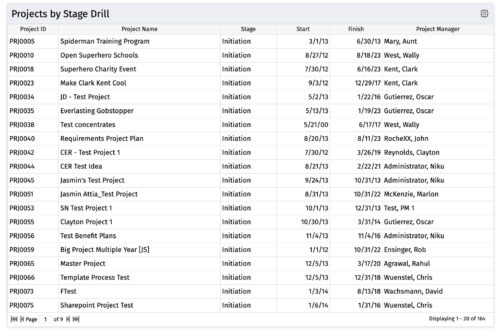
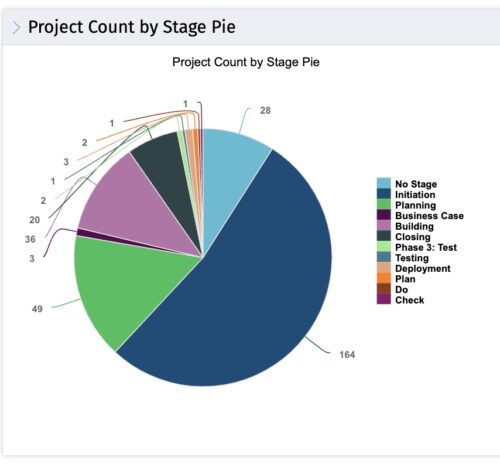 The portlet, Count by Stage with Drilldown is a simple pie based on stage OOTB field. The drill down portlet has stage as a column. Clicking on any of the segments, e.g. Initiation, redirects to the Projects by Stage Drill portlet.
 -
The portlet, Count by Stage with Drilldown is a simple pie based on stage OOTB field. The drill down portlet has stage as a column. Clicking on any of the segments, e.g. Initiation, redirects to the Projects by Stage Drill portlet.
-
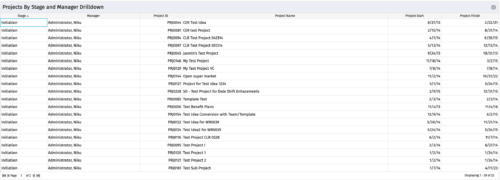
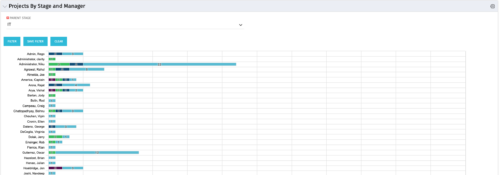 Horizontal Bar Chart displays one bar per manager (manager name on vertical axis). Horizontal axis shows project count. Filtered by Parent Stage. Each bar shows color coded stages, where length of each color is proportional to the count. Data label = count by stage. Mouse-over = stage name and percent count of total projects. Legend = child stage names. Drilldown functionality: Clicking on a bar color yields a project grid portlet with projects in that stage for that manager.
 -
Horizontal Bar Chart displays one bar per manager (manager name on vertical axis). Horizontal axis shows project count. Filtered by Parent Stage. Each bar shows color coded stages, where length of each color is proportional to the count. Data label = count by stage. Mouse-over = stage name and percent count of total projects. Legend = child stage names. Drilldown functionality: Clicking on a bar color yields a project grid portlet with projects in that stage for that manager.


Copyright 2023 • Rego Consulting Corporation • Privacy Policy