
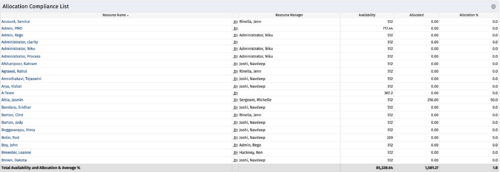
This Allocation Compliance Drilldown Enhancement portlet is used in conjunction with the Allocation Compliance Pie Chart. Once the user selects a specific section of the chart, the Allocation Compliance Drilldown Enhancement will display a list of resources fulfilling that selection. The Allocation Compliance list portlet shows the Resource Name, the Resource Manager, Availability, Allocated Hours and Allocation % for the selection.
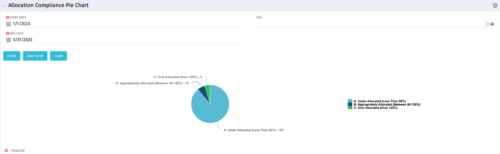
Note: The Allocation compliance pie chart is displayed first based on the filter selection i.e., Start Date, End Date and OBS. The pie chart is displayed as per the following three slices of the pie:
Under Allocated (Less than 80%)
Appropriately Allocated (Between 80-120%)
Over Allocated (Above 120%)
The slice of a pie can be clicked to display resource allocation compliance information in the Allocation Compliance List portlet, as described earlier.
The table below describes the available columns in the Allocation Compliance list portlet. The first 5 are configured in the default view:
|
-
-
This Allocation Compliance Drilldown Enhancement portlet is used in conjunction with the Allocation Compliance Pie Chart. Once the user selects a specific section of the chart, the Allocation Compliance Drilldown Enhancement will display a list of resources fulfilling that selection. The Allocation Compliance list portlet shows the Resource Name, the Resource Manager, Availability, Allocated Hours and Allocation % for the selection. Note: The Allocation compliance pie chart is displayed first based on the filter selection i.e., Start Date, End Date and OBS. The pie chart is displayed as per the following three slices of the pie: Under Allocated (Less than 80%) Appropriately Allocated (Between 80-120%) Over Allocated (Above 120%) The slice of a pie can be clicked to display resource allocation compliance information in the Allocation Compliance List portlet, as described earlier. The table below describes the available columns in the Allocation Compliance list portlet. The first 5 are configured in the default view: Column Label Description Resource Name Name of the Resource Resource Manager Resource Manager Availability Resource Availability Allocated Resource Allocation Allocation % Resource Allocation % Res_id Unique identifier of the Resource -
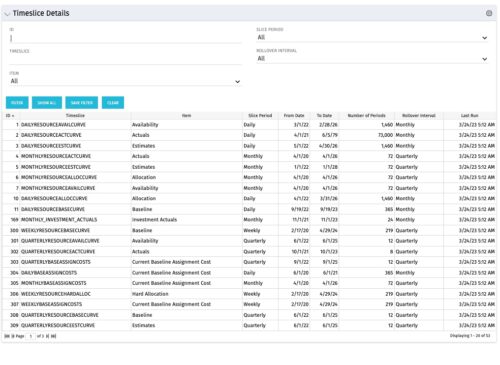 This allows users without admin access to see the timeslice settings and also allows the data to be exported to excel easily. Many organizations like to document their timeslice settings which is a manual process as you cannot export the timeslice page to excel. This allows them to periodically export the portlet results to excel to meet their documentation requirements.
 -
This allows users without admin access to see the timeslice settings and also allows the data to be exported to excel easily. Many organizations like to document their timeslice settings which is a manual process as you cannot export the timeslice page to excel. This allows them to periodically export the portlet results to excel to meet their documentation requirements.
-
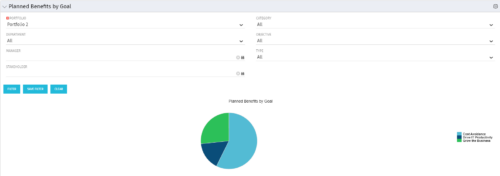 Part of the Business Transformation Package, this pie chart portlet shows planned benefits across the system grouped by Goal. The data is displayed form the investments in a portfolio. The portlet lets the Portfolio Manager know on which GOAL the planned benefit is allocated, so as to target the overall investment spread in the portfolio.
 -
Part of the Business Transformation Package, this pie chart portlet shows planned benefits across the system grouped by Goal. The data is displayed form the investments in a portfolio. The portlet lets the Portfolio Manager know on which GOAL the planned benefit is allocated, so as to target the overall investment spread in the portfolio.
-
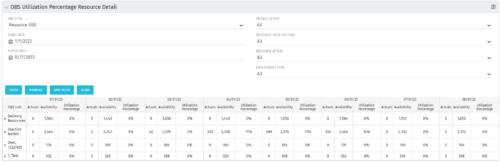
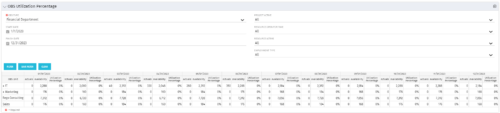
 This portlet depicts the Resource Utilization by comparing actual hours booked as a percentage of total resource availability grouped and totaled by OBS Unit in a hierarchical fashion. Resource availability is determined by the working days and daily availability on the individual Resource Calendar and is depicted on a Monthly basis. This portlet uses Monthly Times and the Time Slice job may need to run before the end user will see results in the portlet. The portlet filters for Project Activity, Resource Open for Time, Resource Activity, and Employment time have been added to OBS Type and the Start and Finish dates. The OBS summary totals show on a single line, but can be clicked (+) to roll out the details behind each OBS total.
 -
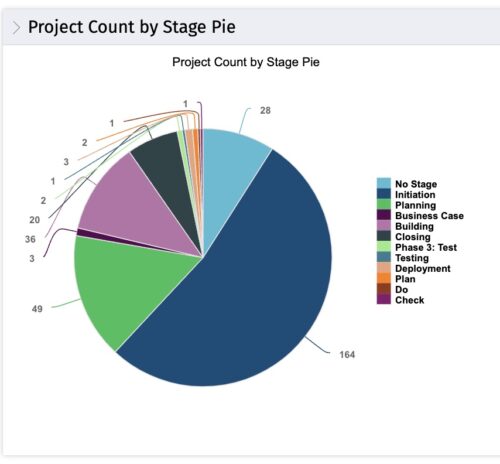 This portlet displays the projects by Stage in a pie chart. Every piece of the pie chart represents a stage of the Project Management methodology applied. The portlet also shows the number of projects on each stage. The legend displays all the different project stages appearing on the portlet. This portlet can be filtered to show only projects from a particular OBS unit or for a particular Project Manager.
 -
This portlet displays the projects by Stage in a pie chart. Every piece of the pie chart represents a stage of the Project Management methodology applied. The portlet also shows the number of projects on each stage. The legend displays all the different project stages appearing on the portlet. This portlet can be filtered to show only projects from a particular OBS unit or for a particular Project Manager.
-
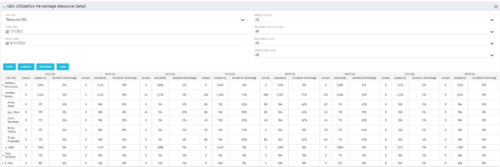
 This view depicts the Resource Utilization by comparing actual hours booked as a percentage of total resource availability grouped and totaled by OBS Unit in a hierarchical fashion. Resource availability is determined by the working days and daily availability on the individual Resource Calendar and is depicted on a Monthly basis. This portlet uses Monthly Times and the Time Slice job may need to run before the end user will see results in the portlet. The portlet filters for Project Activity, Resource Open for Time, Resource Activity, and Employment time have been added to OBS Type and the Start and Finish dates.
 -
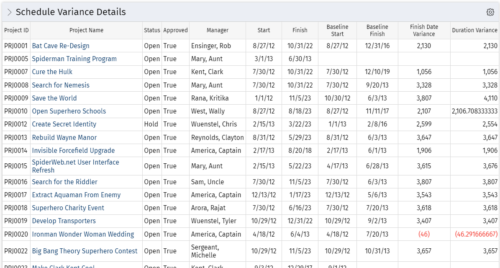 This portlet shows the variance between the schedule finish and baseline finish for projects. The portlet also displays the schedule variance: {(Finish-Start) – (Baseline Finish-Baseline Start)}.
 -
This portlet shows the variance between the schedule finish and baseline finish for projects. The portlet also displays the schedule variance: {(Finish-Start) – (Baseline Finish-Baseline Start)}.
