
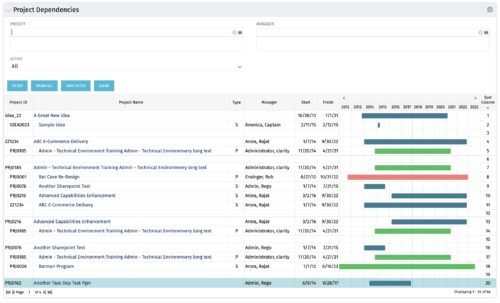
The Project Dependencies portlet displays all projects and their associated dependencies that the logged in user has rights to. This can assist in scheduling and visualizing the breakout of dependencies.
The table below describes the available columns in the portlet.
|
-
-
 Bar Chart displays average percent variance for all active projects by OBS unit. Percent variance = Planned Cost - Budgeted Cost / Budgeted Cost * 100. Projects with no Budgeted Cost are ignored for the calculation. Then all project variance percentages are algebraically added (some may be negative), and divided by total projects with a variance. This yields the Average Percent Variance. This calculation is performed for active projects in each OBS unit. OBS units include all units at all levels where projects are attached. Portlet filterable by OBS, Financial Status, and Financially Approved. Vertical axis = OBS Unit Name. Horizontal axis = Variance Percent. Data value = Average Percent Variance. Mouseover value = OBS Name + Average Variance Percent.
 -
Bar Chart displays average percent variance for all active projects by OBS unit. Percent variance = Planned Cost - Budgeted Cost / Budgeted Cost * 100. Projects with no Budgeted Cost are ignored for the calculation. Then all project variance percentages are algebraically added (some may be negative), and divided by total projects with a variance. This yields the Average Percent Variance. This calculation is performed for active projects in each OBS unit. OBS units include all units at all levels where projects are attached. Portlet filterable by OBS, Financial Status, and Financially Approved. Vertical axis = OBS Unit Name. Horizontal axis = Variance Percent. Data value = Average Percent Variance. Mouseover value = OBS Name + Average Variance Percent.
-
 Pie Chart Portlet displays counts of active projects with various Stale ratings. Calculation is Percent Stale Tasks = number of open (not completed) tasks with a finish date over 15 days old, divided by total open tasks. Filterable by OBS structure and project manager. Data label = project count. Mouse-over and Legend labels = stale rating. More than 90% Stale means 90 to 100% of open tasks on a project have finish dates older than 15 days. More than 71% Stale means 71 to 89% of open tasks on a project have finish dates older than 15 days. 0 - 70% Stale means fewer than 70% of open tasks on a project have finish dates older than 15 days.
 -
Pie Chart Portlet displays counts of active projects with various Stale ratings. Calculation is Percent Stale Tasks = number of open (not completed) tasks with a finish date over 15 days old, divided by total open tasks. Filterable by OBS structure and project manager. Data label = project count. Mouse-over and Legend labels = stale rating. More than 90% Stale means 90 to 100% of open tasks on a project have finish dates older than 15 days. More than 71% Stale means 71 to 89% of open tasks on a project have finish dates older than 15 days. 0 - 70% Stale means fewer than 70% of open tasks on a project have finish dates older than 15 days.
-
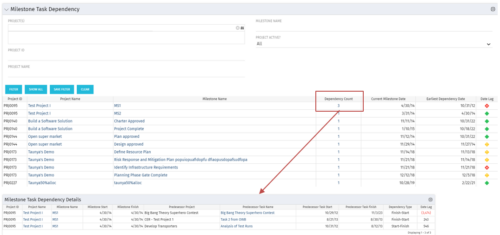 The Milestone Task Dependency portlet shows the milestone task dependency count and has a drilldown to the details. The portlet looks at the dependency impact on milestones, and is not limited to just dependencies that are on different projects. The lag days calculation is based off of the maximum dependency impact and the drilldown portlet (Milestone Task Dependency Details :::: rego_milestone_dependency_det)shows the details for each.
 -
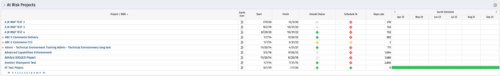 Part of the Business Transformation collection, this bar-chart portlet displays investments and (if exists) any child investments, which are at risk with regard to the schedule of the investments.
 -
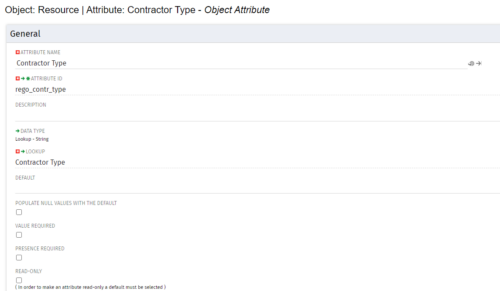
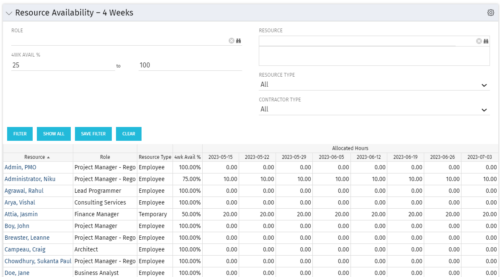 Resource Availability – 4 Weeks is a grid portlet that displays all resources with their total allocated hours by week, and an average availability percent (4 Wk Avail %) for next four weeks. If % Available is negative, this indicates an over-allocation. Zero% Average Availability indicates fully allocated (no remaining availability). Filterable by Role, Resource, Resource Type, Full-Time/Part-Time, Availability Range. Contractor Type is a custom attribute (Lookup - String) created on the Resource object. It is attached to the lookup, Contractor Type (Lookup ID: REGO_CONTRACTOR_TYPE) that has static values Part Time (PT) and Full Time(FT).
 -
 Part of the Business Transformation collection, this bar-chart portlet displays number of investments per stage. This provides a holistic overview of where the projects are within the organization.
 -
Part of the Business Transformation collection, this bar-chart portlet displays number of investments per stage. This provides a holistic overview of where the projects are within the organization.
-
 Funnel Chart displays aggregated counts of Ideas by “Idea Progress”, a custom attribute. Chart shows Idea Progress names in legend, and count total is available as a mouse-over. No filters available on this portlet.
 -
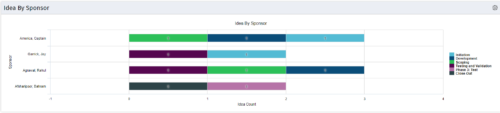 This portlet uses a bar graph to show the count of ideas by stage - grouped by the sponsor OBS. The X-axis displays the count and the Y-axis denotes the sponsor.
