-
 Broadcom’s Laureen Knudsen and Noël Rodriguez discuss the current and evolving state of the PMO.
 -
 Lean Portfolio Management (LPM) is one of the most researched and in demand topics for modern enterprises. Come learn what LPM is, key LPM practices and roles needed for success, and how Clarity and Rally provide end to end visibility from strategy to execution.
 -
 Are you struggling to get data compliance within your instance of Clarity? This class will talk about common compliance problems and discuss potential solutions to help your increase compliance within your organization.
 -
 This portlet displays the % allocation of resources to projects. The portlet shows if the resource is allocated to the projects as an individual resource or as part of an Agile team, in which case it will display the resource % allocation to the team and what that will represent in terms of % allocation to the project. The Total Allocation % display the allocation of the resource to all investments is allocated to. Remaining Capacity and Over/Under columns will help identify the resources that still have availability and the ones that are over allocated.
 -
 The Resources Demand Summary portlet displays the total Estimate to Complete (ETC’s) for Resources. The portlet displays the total per time scale value selected per resource and a grand total of all ETC’s for the selected time period. Filtering capabilities allow the user to filter by an individual resource, resource manager, time scale values, dates, and OBS. The portlet provides a Resource Manager with a single location to view ETC’s by Resource.
 -
The Resources Demand Summary portlet displays the total Estimate to Complete (ETC’s) for Resources. The portlet displays the total per time scale value selected per resource and a grand total of all ETC’s for the selected time period. Filtering capabilities allow the user to filter by an individual resource, resource manager, time scale values, dates, and OBS. The portlet provides a Resource Manager with a single location to view ETC’s by Resource.
-
 The Timesheet Notes portlet displays all timesheet notes split out by resource, investment and task. This is very useful in situations where you want to review multiple notes as you do not have to open each note separately. The table below describes the available filter fields in the portlet.
Column Label Description Timesheet Period Start Range of time periods to display filtered by start date Timesheet Period Finish Range of time periods to display filtered by finish date Resource Resource(s) to display Type Note on a timesheet or time entry (task specific) -
The Timesheet Notes portlet displays all timesheet notes split out by resource, investment and task. This is very useful in situations where you want to review multiple notes as you do not have to open each note separately. The table below describes the available filter fields in the portlet.
Column Label Description Timesheet Period Start Range of time periods to display filtered by start date Timesheet Period Finish Range of time periods to display filtered by finish date Resource Resource(s) to display Type Note on a timesheet or time entry (task specific) -

This portlet displays the monthly allocation per resource. The PM can view by the RM or the resource to get the data for monthly resource allocations. The table below describes the available filter fields in the portlet. Column Label Description Work Effort Manager Manager of the Investment the Work Effort is on Work Effort Active Active status of the Investment the Work Effort is on Resource Resource’s Name Internal Resource ID Resource’s ID Zero Allocation Show Allocations that equal zero Open for Time Entry Is the Resource Open for Time Entry Resource Active Resource’s Active status Role Resource’s Primary Role OBS Unit Resource’s OBS Start Allocation Start Time to filter by End Allocation Finish time to filter by -
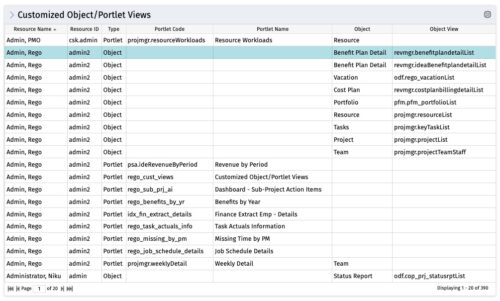 The Customized Object/Portlet Views portlet displays all user edited object/portlet views and the resource(s) that have edited them. This can assist in identifying users who need to be notified prior to publishing view changes. The table below describes the available columns on the object.
Column Label Description Resource Name Name of the resource Resource ID ID of the resource Type Object or Portlet Portlet Code ID of the portlet Portlet Name Name of the portlet Object Associated Object Object View ID of the modified view on the object Object Code Internal code used by the query pkid Internal code used by the query portlet_dbid Database id of the portlet res_dbid Database id of the resource -
 This is a graphic portlet that pulls the average schedule variance by OBS node of the project. The portlet allows you to choose any OBS that is associated to the Project Object. Users can filter by:
- OBS Type
- If the project is financially approved?
- Financial Status
-
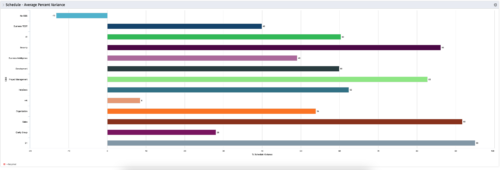
This is a graphic portlet that pulls the average schedule variance by OBS node of the project. The portlet allows you to choose any OBS that is associated to the Project Object. Users can filter by:
- OBS Type
- If the project is financially approved?
- Financial Status


Copyright 2023 • Rego Consulting Corporation • Privacy Policy