-
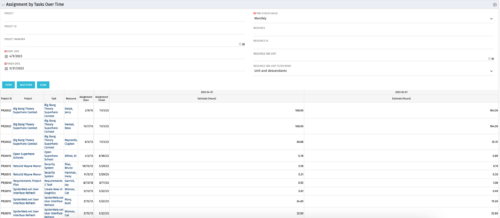 The Assignments by Task Over Time portlet displays all assignments by task for all resources using the timeslices. This portlet is useful for determining which tasks a user is assigned to or how many hours the user is assigned to a task. The user may filter on certain criteria that include: project name/ID, date range, resource name/ID, and resource OBS unit.
 -
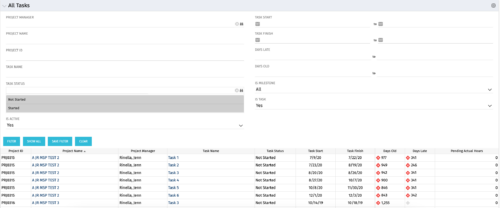 The All Tasks portlet displays all tasks related to active projects that the logged in user has view rights to. The portlet provides the project manager a single place to view tasks across multiple projects without having to go into each project individually, and allows for more efficient management and reporting across projects. The portlet displays project actuals and estimates from the project (datamart tables). The portlet allows analysis like:
- PMs may have several critical tasks that were supposed to start on a certain date. To verify progress, they filter for that start date to perform a review of the tasks.
- PMs can review days late to see how tasks are doing against the baseline date (<7 days is green, 7-14 is yellow, and >14 is red)
- PMs can review days old to see how tasks are doing against today’s date (<7 days is green, 7-14 is yellow, and >14 is red)
Column Label Description Project ID Unique project identifier Project Name Name of the project Project Manager Manager of the project Task Name Name of the task Task Status Not Started, Started, or Completed Task Start Start Date of this task Task Finish Finish Date of this task -
The All Tasks portlet displays all tasks related to active projects that the logged in user has view rights to. The portlet provides the project manager a single place to view tasks across multiple projects without having to go into each project individually, and allows for more efficient management and reporting across projects. The portlet displays project actuals and estimates from the project (datamart tables). The portlet allows analysis like:
- PMs may have several critical tasks that were supposed to start on a certain date. To verify progress, they filter for that start date to perform a review of the tasks.
- PMs can review days late to see how tasks are doing against the baseline date (<7 days is green, 7-14 is yellow, and >14 is red)
- PMs can review days old to see how tasks are doing against today’s date (<7 days is green, 7-14 is yellow, and >14 is red)
Column Label Description Project ID Unique project identifier Project Name Name of the project Project Manager Manager of the project Task Name Name of the task Task Status Not Started, Started, or Completed Task Start Start Date of this task Task Finish Finish Date of this task -
 The All Risks portlet displays all risks related to active projects that the logged in user has view rights to access. The portlet provides the project manager a single place to view risks across multiple projects without having to go into each project individually, and allows for more efficient management and reporting across projects. The portlet displays Project ID, Project, Risk ID, Risk, Category, Assigned to, Status, Probability, Impact, Priority, Target Resolution Date, and Days opened. The filter allows narrowing down of the risks by several different criteria. Note: Only the projects that the user has viewer rights to see will show up in the list.
 -
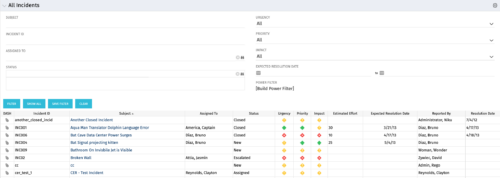 The All Incidents portlet shows all Incidents the user has view rights on and provides a single view to increase ease of management. Status indicators provide a quick overview of incident statuses so a user may prioritize. The filter then allows the user to narrow their search using date ranges and/or resources assigned. Other alternatives for filtering include the status, urgency, priority or impact of the Incident.
 -
The All Incidents portlet shows all Incidents the user has view rights on and provides a single view to increase ease of management. Status indicators provide a quick overview of incident statuses so a user may prioritize. The filter then allows the user to narrow their search using date ranges and/or resources assigned. Other alternatives for filtering include the status, urgency, priority or impact of the Incident.
-
 This course will take a deeper dive into Clarity portlets. We'll take the next step after configuring object based portlets, and learn how to write an NSQL query to provide data to your portlet. We'll cover different types of portlets, grids, graphs, and multi-dimensional portlets, demonstrate how to surface the portlet on a page, and channel to it from Modern UX. Including HTML portlets and scripting tips.
 -
 This quick discussion will highlight tips for ensuring you will get the most out of your Rego University experience. We will discuss how to select classes, meet with peers, and obtain one on one advice over the 3 days of the conference.
 -
 Aligning work to organizational strategy is a fundamental requirement in today's ever-changing marketplace. High performing organizations are moving beyond basic connections to introduce strategic hierarchies that are tied to real measurements of business value via Clarity's Objectives and Key Results (OKRs). Join our expert guides as they present key concepts, best practices, and the evolution of strategic alignment.
 -
 Gaining adoption with Clarity can sometimes feel daunting. However, there are some great best practices and lessons learned that drive successful and easy adoption! Come to this session and learn from your peers about better and easier adoption practices. This roundtable will be moderated and give you some great ideas to take home! We will have an expert panel and then divide into small groups to discuss customer selected topics. 100% sharing, 100% learning.
 -
 With ValueOps Insights you can gain transparency into full value stream analytics. Come learn about metrics to run your business including flow metrics, DORA, and value realization metrics that give your management team a compass to find the value your teams are delivering.
 -
 Did you stray from OOTB? Was that the right decision? This will be a discussion on pros and cons of sticking to Clarity’s stock attributes, views, and general capabilities. When does it make sense to avoid custom configuration? Conversely, when does it make sense to move beyond the standard OOTB setup?


Copyright 2023 • Rego Consulting Corporation • Privacy Policy