-
 Part of the Business Transformation collection, this pie chart portlet displays realized benefit, grouped by category for portfolio investments. It uses System Provider: Portfolio Investment Provider.
 -
 This portlet shows the project costs by Month. The information displayed includes:
- Start Date for project
- End Date for project
- Budgeted Cost
- Planned Cost
- Actual Hours
-
This portlet shows the project costs by Month. The information displayed includes:
- Start Date for project
- End Date for project
- Budgeted Cost
- Planned Cost
- Actual Hours
-
This portlet shows the project costs by Month. The information displayed includes:
- Start Date for project
- End Date for project
- Budgeted Cost
- Planned Cost
- Actual Hours
-
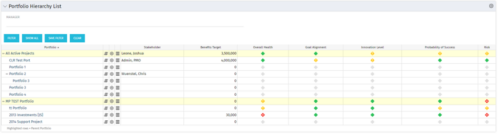 Part of the Business Transformation Package, this portlet displays the portfolios with hierarchy (child portfolio(s)). The portlet displays the basic portfolio fields like – manager, stakeholder, etc. A Metrics subpage can be created with the fields on the “Properties – Metrics.”. The fields: Overall Health, Goal Alignment, Innovation Level, Probability of Success are custom fields and can be configured on a subpage.
 -
Part of the Business Transformation Package, this portlet displays the portfolios with hierarchy (child portfolio(s)). The portlet displays the basic portfolio fields like – manager, stakeholder, etc. A Metrics subpage can be created with the fields on the “Properties – Metrics.”. The fields: Overall Health, Goal Alignment, Innovation Level, Probability of Success are custom fields and can be configured on a subpage.
-
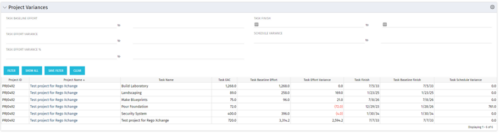 This Project Variances portlet provides a project manager a consolidated view of all of their active projects and open project tasks and shows them the baseline variance for the task EAC’s and the task start and finish dates. This gives the project manager a single place to view and manage how their projects are progressing against their baselines. The PM can easily detect when projects are running behind and pinpoint which tasks are causing the variance in the schedule.
 -
This Project Variances portlet provides a project manager a consolidated view of all of their active projects and open project tasks and shows them the baseline variance for the task EAC’s and the task start and finish dates. This gives the project manager a single place to view and manage how their projects are progressing against their baselines. The PM can easily detect when projects are running behind and pinpoint which tasks are causing the variance in the schedule.
-
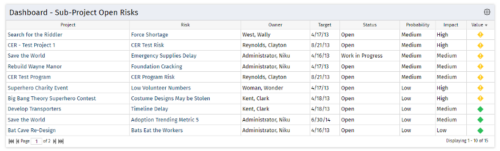 The Program Dashboard Sub-Project Open Risks portlet gives the ability to view all risks on the sub-projects of a program that are not closed or resolved. The portlet will pull the "id" from the page it is placed on, so this portlet is usually placed on the dashboard tab. The portlet sorts the issues first by value, in descending order, and then by target date. It displays the sub-project name, risk name, owner, target date, status, probability, impact and value.
 -
The Program Dashboard Sub-Project Open Risks portlet gives the ability to view all risks on the sub-projects of a program that are not closed or resolved. The portlet will pull the "id" from the page it is placed on, so this portlet is usually placed on the dashboard tab. The portlet sorts the issues first by value, in descending order, and then by target date. It displays the sub-project name, risk name, owner, target date, status, probability, impact and value.


Copyright 2023 • Rego Consulting Corporation • Privacy Policy