-
 The Grant Edit Time to Proxy process utilizes the proxy feature within Clarity to assign timesheet edit rights to a proxy for any resources that the user is the current resource manager for. The process, when run, will also remove any timesheet edit rights for any users if the proxy has been removed or the resource manager has changed. This process would allow a resource manager to designate a subordinate the ability to enter time on other resources’ behalf while still going to the resource manager for approval.
 -
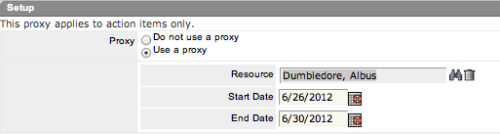 The Grant Approve Time to Proxy process utilizes the proxy feature within Clarity to assign timesheet approval and edit rights to a proxy for any resources that the user is the current resource manager for. The process, when run, will also remove any timesheet approval and edit rights for any users if the proxy has been removed or the resource manager has changed. This process is used for resource managers that will be out of the office.
 -
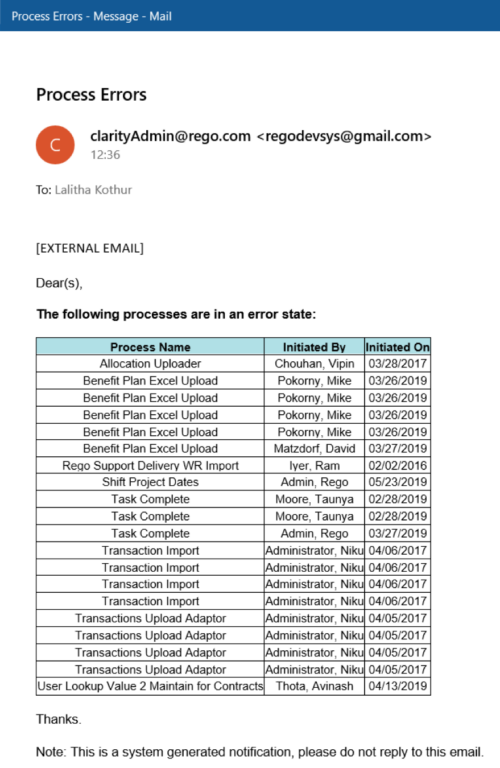 The Email Process Instance Errors workflow process will email a selected group within Clarity informing them of process errors that are currently in the system. The selected group is input through a gel parameter so it may be easily changed. This workflow helps to resolve errors quickly by emailing group members of the errors within the system so they may take action immediately.
 -
The Email Process Instance Errors workflow process will email a selected group within Clarity informing them of process errors that are currently in the system. The selected group is input through a gel parameter so it may be easily changed. This workflow helps to resolve errors quickly by emailing group members of the errors within the system so they may take action immediately.
-
 Are you on an older version of CA PPM? Do you want to understand the value of the new features and functions in recent versions? Have you seen the new UX and do you wonder when is the right time to move over? This class is a demonstration of the new UX, new features in both classic and new UX, and the value of these features for customers.
 -
 Most organizations use CA PPM as part of an annual planning process, in conjunction with an ITFM or financial system. There is often a struggle to know where CA PPM fits into the process and how to effectively connect the data and processes between these tools. In this class, we will discuss how a PPM tool and an ITFM tool fit together to support annual planning.
 -
 Course Description: People are the #1 key to successful implementation, acceptance, and sustaining adoption after the project is long gone. Learn some tips and tricks on how to keep key stakeholders engaged.
 -
 Course Description: Do some folks in your organization view Clarity PPM as worthless or of little value? In this class, we will discuss how to increase the value perception of Clarity PPM and innovative ways to sell the value Clarity PPM provides to stakeholders and users.
 -
 Course Description: Some PMO members have started receiving questions about the relevance of the PMO. This session will discuss why the PMO is even more relevant for an organization as it shifts to an Agile mindset.
 -
 Course Description: Are you ready to implement a continuous improvement practice within your PMO? This class is a working session to help build and sustain a continuous assessment initiative within your PMO, helping to manage goals and objectives from start-up through maturity. We will also discuss growth mapping to processes, tools, and strategic objectives.
 -
 Course Description: Do you struggle with how to implement a perpetual education program that continues to add value within the organization? This session will discuss best practices in the creation and structuring of an ongoing training and mentoring approach to assist with Clarity PPM adoption.
 -
 Course Description: No matter how hard we try many organizations cannot pry Excel out of the hands of project and resource managers. In this class, we will explore possibilities that embrace Excel as a great data entry tool. We will show useful case studies on quick Excel integrations deployed for customers.


Copyright 2023 • Rego Consulting Corporation • Privacy Policy