-
 Are you leveraging Clarity's Roadmaps yet? Come to this session to learn how OOTB Roadmaps work. You will learn how to configure views, targets, widgets, boards, and more! You will leave with great ideas you can bring back to your organization!
 -
 This training document is a Rego Consulting Quick Reference Guide to assist with the updating, synchronizing and deleting of Roadmap investments in Clarity’s Modern User Experience. This doc references version 16.3 views. Detail is provided on how to update individual Roadmap items within the Grid View, Timeline View and Board View. Included are instructions on how to synchronize Roadmap investments and how to delete an investment from a Roadmap.
 -
This training document is a Rego Consulting Quick Reference Guide to assist with creation of Roadmaps and the adding of investments to Roadmaps in Clarity’s Modern User Experience. This doc references version 16.2.1 views. Document provides detail on the Import from PPM function, Import from CSV as well as manual creation of Roadmap items. Detail is provided on how to create a manual Roadmap item from the Grid View, Timeline View or Board View. Instructions are also provided on how to synchronize a Roadmap.
-
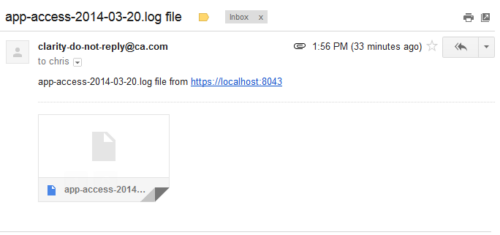 This process emails a log file, as an attachment, to the specified email address. This is useful for On-Demand clients to be able to view the entire log file instead of just a partial one in the “security.logs” hidden page.
 -
 XOG & Query Bridge (XQ) is a 2-in-1 Clarity PPM toolset that provides enhanced functionality and an improved user experience when retrieving and inserting data to/from Clarity PPM environments. XQ is available as a Web-based application and also as a downloadable desktop version that supports both On-premise and On-demand Clarity PPM implementations. https://xogbridge.com/
 -
 This training document is a Rego Consulting Quick Reference Guide to assist with the creation of Hierarchies in Clarity’s Modern User Experience.
 -
 This training document is a Rego Consulting Quick Reference Guide to assist with the creation and management of Ideas in Clarity’s Modern User Experience. The document reviews Creating an Idea and Editing of an Idea.
 -
 A Quick Reference Guide to assist in creating and editing Project Baselines in Clarity Classic with the Phoenix theme.
 -
 A Quick Reference Guide to assist in using the Hierarchies Grid view in Clarity’s Modern UX. The Hierarchy grid provides the ability to create new hierarchies, filter, add fields to the gird, save and load views, export the list of hierarchies and review the details of a hierarchy.
 -
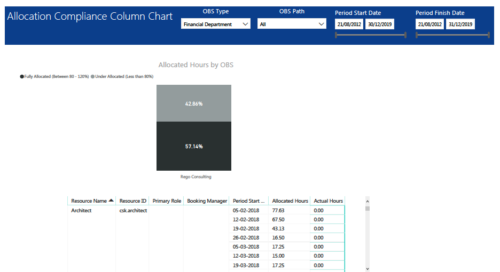 Allocation Compliance Column Chart report provides resource managers a single place to view Allocation compliance for various resources. It displays the following: Allocated Hours by OBS chart: Stacked Column chart that displays percentage of resources that are fully allocated (80 -120 %) and under allocated (less than 80%) for a particular OBS and selected period range. Grid: Displays Resource Name, Resource Id, Primary Role, Booking Manager, Period, Allocated hours and Actual hours during that period. You can further narrow your search by OBS Type, OBS Path & Period Start Date range.
 -
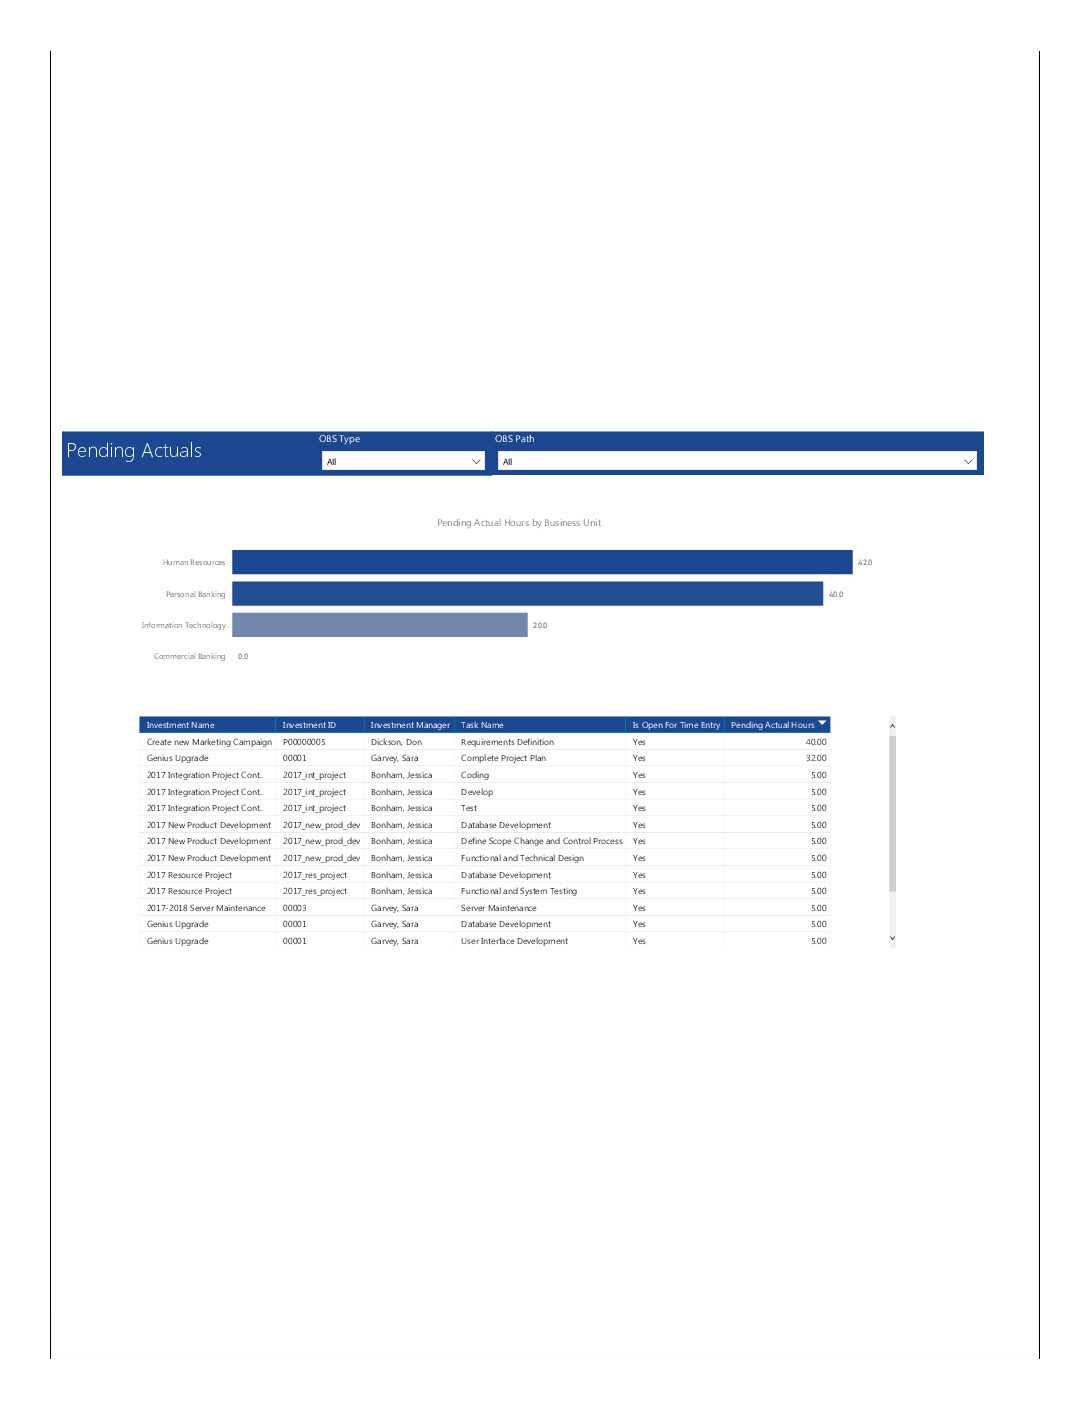 Pending Actuals report provides the Project Managers a single place to view all the pending actuals on tasks across multiple projects. This report provides graphical representation (bar chart) of pending actual hours by business unit. User can further drill down the details by clicking on particular business unit Managers can use this portlet to analyze the actuals that have been submitted but not posted on tasks. You can further narrow your search by OBS Type & Path.
 -
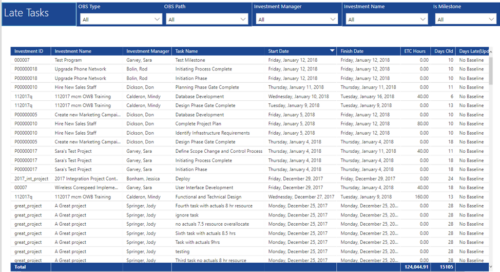 Late Tasks report provides the Project Managers a single place to view all the Tasks that are past their baseline finish date. This report provides information such as Investment ID, Investment Name, Investment Manager, Task Name, Start Date, Finish Date, ETC Hours, Days Old and Days Late in Table view. User can further narrow their search by OBS Type & Path, Investment Manager, Investment Name and whether the Task is a Milestone or not.


Copyright 2023 • Rego Consulting Corporation • Privacy Policy