-
 Are you looking to extend your investment in Clarity and share it with other stakeholders in your company? We know organizations today are looking for cool collaborative ways to work. Come check out what Clarity has to offer.
 -
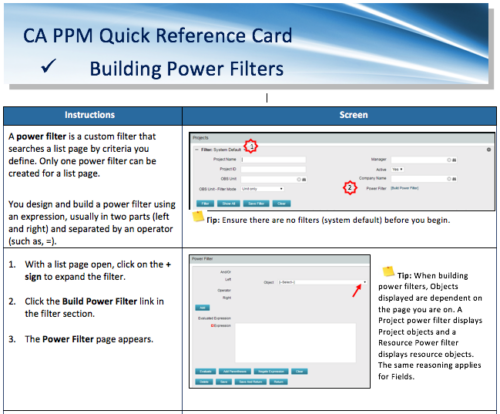 A Quick Reference Card to assist in the building of Power Filters in CA PPM. A power filter is a custom filter that searches a list page by criteria you define. Only one power filter can be created for a list page.
 -

 The Capacity Graph portlet displays Availability, Allocations, Actuals and Assignments for one or more active resource(s) in a single view. This portlet pulls data from timeslices, and allows the user to filter on a weekly, monthly or quarterly data. The Estimated Time to Complete (ETC) and Allocation data will only show for projects that are active. This portlet provides Resource Managers, PMOs and Executives with a simple way to analyse: Allocations vs. Availability, Allocations vs. Actuals, Allocations vs. ETC and ETC vs. Availability. The graph allows the user to determine where areas of improvement may exist and quickly identify potential areas of constraint. Note: the information displayed is dependent on what the user has security rights to view.
 -
 The Capacity Graph portlet displays Availability, Allocations, Actuals and Assignments for a Clarity user in a single view. This portlet pulls data from timeslices, and allows the user to filter on a weekly, monthly or quarterly data. The Estimated Time to Complete (ETC) and Allocation data will only show for projects that are active. This portlet provides a Clarity user with a simple way to analyse their: Allocations vs. Availability, Allocations vs. Actuals, Allocations vs. ETC and ETC vs. Availability. The graph allows the user to determine where areas of improvement may exist and quickly identify potential areas of constraint.
 -
The Capacity Graph portlet displays Availability, Allocations, Actuals and Assignments for a Clarity user in a single view. This portlet pulls data from timeslices, and allows the user to filter on a weekly, monthly or quarterly data. The Estimated Time to Complete (ETC) and Allocation data will only show for projects that are active. This portlet provides a Clarity user with a simple way to analyse their: Allocations vs. Availability, Allocations vs. Actuals, Allocations vs. ETC and ETC vs. Availability. The graph allows the user to determine where areas of improvement may exist and quickly identify potential areas of constraint.
-
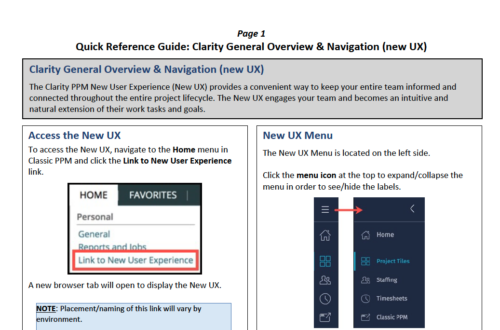 The Clarity PPM New User Experience (New UX) provides a convenient way to keep your entire team informed and connected throughout the entire project lifecycle. The New UX engages your team and becomes an intuitive and natural extension of their work tasks and goals.
 -
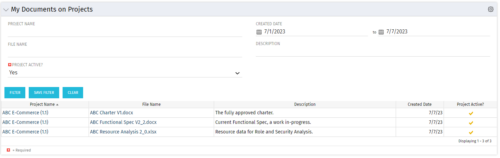 This Portlet allows users to quickly access Documents they uploaded into Projects via the Classic UI à Collaboration tab or via the New UX Documents module. Clicking on the File Name downloads the file, clicking on the Options gear allows users to export the list to Excel.
 -
 A presentation slide deck from Rego University 2022. Document used for Broadcom’s presentation on Collaborative Work Management.
- Real Life Stories – Why this is so important
- Overview and Latest Enhancements
- Demonstration and Use Cases
-
 This training document is a Rego Consulting Quick Reference Guide to assist with use of the Common Grid. You can find the grid throughout the application to manage projects, tasks, roadmaps, ideas, and timesheets to name a few. The QRG reviews View Options, Column Adjustments, the Details Panel and more.
 -
 The concepts of creativity are tools and habits that help you and your team become more creative. During this session, you will learn simple tricks and methods to encourage a more creative work environment. Join this session to learn how to structure effective team meetings, workshops and all-inclusive ideation sessions. Even learn about some great work habits to boost your career!
 -
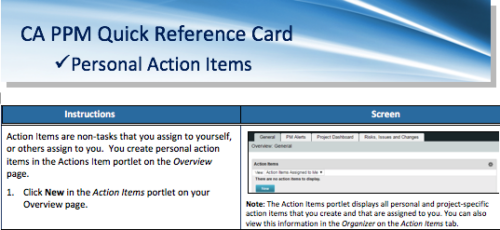 A quick reference card to assist you in making Action Items in CA PPM. Action Items are non-tasks that you assign to yourself, or others assign to you. You create personal action items in the Actions Item portlet on the Overview page.


Copyright 2023 • Rego Consulting Corporation • Privacy Policy