-
 The Hours and Cost by Vendor – Grid portlet displays vendor hour or costs by month grouped by vendor. Using this portlet, management is provided with a quick overview of vendor costs or hours by month for a set of time without running a report or navigating to each resource individually. This portlet uses the monthly actual timeslices. The user may filter by vendor, vendor ID, date, and hours/cost in addition to the start/finish and hours/cost. Once populated, the grid will display all vendors that currently have hours/cost for the selected time frame.
 -
 The Hours and Cost by Vendor - Graph portlet displays vendor hour or costs by month. Using this portlet, management is provided with a graphical representation of vendor costs or hours by month for a set of time without running a report or navigating to each resource individually. This portlet uses the monthly actual timeslices. Additionally, the user must select a date range and whether to display hours or costs. Once populated, the graph will display all vendors that currently have hours and cost for the selected date range.
 -
 The Time by Stage portlet displays time logged to each project task stage. The portlet displays the project id, project name, task stage, and charge code for each different task stage on the project. This portlet provides management with a quick view of all project task stages by project without having to navigate into each project individually.
 -
The Time by Stage portlet displays time logged to each project task stage. The portlet displays the project id, project name, task stage, and charge code for each different task stage on the project. This portlet provides management with a quick view of all project task stages by project without having to navigate into each project individually.
-
 The Time by Stage and Timescale – Graph portlet displays a graphical representation of hours for all tasks, by stage, for a user-defined time period on projects. The user may filter the results on: Time Scale, Resource OBS Unit, and Date Range. This portlet pulls data from the timeslices. Using this portlet, management can determine if excess time is being spent on certain task stages within projects.
 -
The Time by Stage and Timescale – Graph portlet displays a graphical representation of hours for all tasks, by stage, for a user-defined time period on projects. The user may filter the results on: Time Scale, Resource OBS Unit, and Date Range. This portlet pulls data from the timeslices. Using this portlet, management can determine if excess time is being spent on certain task stages within projects.
-
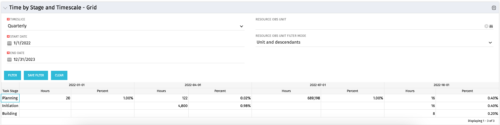 The Time by Stage and Timescale – Grid portlet displays hours for all tasks on projects by their stage for a user-defined time period. The user may narrow the results by time scale, resource OBS unit, and dates. The portlet not only provides the total hours per stage, but also the percentage of time spent on each task type. This portlet pulls data from the timeslices. Using this portlet, management can determine if excess time is being spent on a certain task stage within a project.
 -
The Time by Stage and Timescale – Grid portlet displays hours for all tasks on projects by their stage for a user-defined time period. The user may narrow the results by time scale, resource OBS unit, and dates. The portlet not only provides the total hours per stage, but also the percentage of time spent on each task type. This portlet pulls data from the timeslices. Using this portlet, management can determine if excess time is being spent on a certain task stage within a project.
-
 The Time By Type - Pie Chart portlet is a graphical representation of time by type of investment for all resources the logged in user has security rights to view. This portlet pulls from the daily timeslices, and can be used for determining what types of projects receive the majority of hours. The filter option allows for entry of a specific start date and finish date.
 -
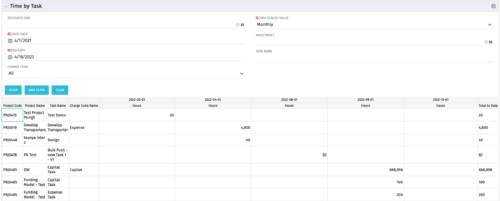 The Time by Task portlet displays time logged to tasks for all investments the logged in user has security rights to view - pulling data from the timeslices. It is capable of displaying the data by weekly, monthly, quarterly or annually segments. The portlet may also be filtered by investment and resource OBS.
 -
The Time by Task portlet displays time logged to tasks for all investments the logged in user has security rights to view - pulling data from the timeslices. It is capable of displaying the data by weekly, monthly, quarterly or annually segments. The portlet may also be filtered by investment and resource OBS.


Copyright 2023 • Rego Consulting Corporation • Privacy Policy