
Rego’s Clarity Adoption Metrics package consists of two sets of metrics: Project metrics, and Resource metrics. Project metrics measure how effectively project managers are using Clarity to manage their projects. Resource metrics measure how effectively resource managers are using Clarity to manage resources.
Metrics are scored on a scale of 0 to 5, with higher scores indicating greater adoption and use. All metrics can be viewed numerically or graphically, and can be broken out by OBS. In addition, metric data can display as a 12-month rolling history to help identify trends. Project metrics can also display by lowest / highest adoption rates for a specific resource metric or all resource metrics.
There is a variety of way to view the Adoption Metric data, therefore, Rego has made this simple by creating an Adoption Metrics object that contains multiple tabs. Each tab displays one or more of the Project or Resource Adoption Metrics. Based on the nature of the Metrics some tabs will allow the ability to use a pull down menu to select a specific Adoption Metric. There is also a Metrics trending view that pulls monthly snapshots of the metrics.
Project metrics consist of the following:
|
-

-
 This training document is a Rego Consulting Quick Reference Guide to assist with adjustments to timesheet in Clarity’s Modern User Experience.
 -
 This training document is a Rego Consulting Quick Reference Guide to assist Admins with Timesheet settings.
 -
 You are no longer regulated to the desktop browser to respond to action items. Learn how Rego solved this problem using just your email. We’ll talk about various use cases where you would get maximum benefit from a simple response on an action item directly from your email. It doesn’t matter if you are using email on your desktop, laptop, phone or tablet. The Action Item Responder as you covered.
 -
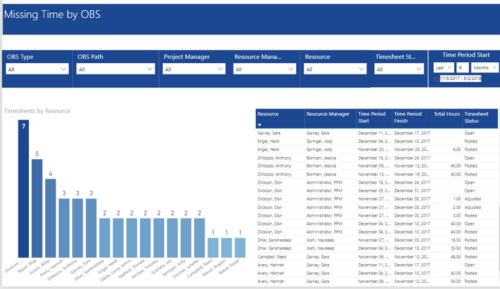 Missing Time by OBS report displays Resource whose timesheets are missed. There is Clustered Column Chart which displays Timesheets count by Resource. Also, there is table view of Resource, Resource Manager, Time Period Start and Finish Dates, Total Hours and Timesheet status. User can narrow their search by OBS Type & Path and Project Manager, Resource Manager, Resource, Timesheet Status and Time Period Start Date (Relative or Specific Date Range).
 -
 This training document is a Rego Consulting Quick Reference Guide to assist with timesheet approval in Clarity’s Modern UX. The doc reviews Accessing and Selecting Timesheets, Reviewing Submitted Timesheets, Approving Timesheets, Returning Timesheets and the Timesheet Grid.
 -
 This training document is a Rego Consulting Quick Reference Guide to assist with the process of entering and submitting timesheets in Clarity’s Modern User Experience. The document reviews Accessing and Selecting Timesheets, Population of the Timesheet, and Updating Time & Submitting.
 -
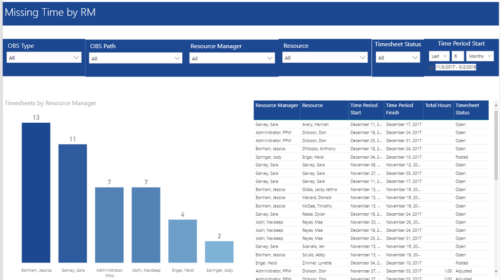 Missing Time by RM report displays Resources whose timesheets are missed by Resource Manager. There is Clustered Column Chart which displays missed timesheets count by Resource Manager. Also, there is table view of Resource Manager, Resource, Time Period Start and Finish Dates, Total Hours and Timesheet status. User can narrow their search by OBS Type & Path, Resource Manager, Resource, Timesheet Status and Time Period Start Date (Relative or Specific Date Range).
 -
 A slide deck that reviews the processes for time entry and approval of timesheets in Clarity’s Modern UX. Used for Rego’s training engagements, it covers the Time Entry process via flow chart, steps for submitting a timesheet, adjusting a returned timesheet, and adding or removing tasks from a timesheet.
 -
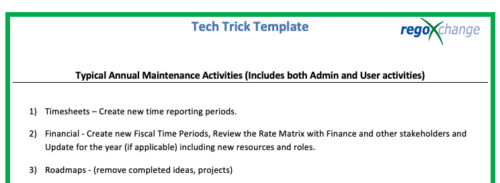 This is a list of 12 typical maintenance items that should be completed for Clarity on an annual basis. There is also a short list of items that should be completed periodically depending on client policies.
 -
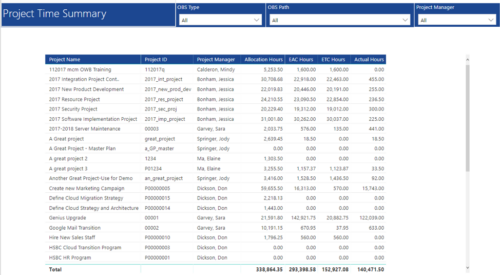 Project Time Summary report provides view of Allocation hours, EAC hours, ETC hours and Actual hours for Projects. User can further narrow their search by OBS Type & Path and Project Manager.
 -
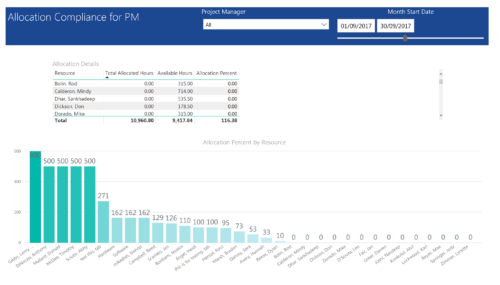 Allocation Compliance by PM report provides project managers a single place to view Available hours, Allocation Hours and Allocation Percentage of Investment Team Resources. It considers the investments of selected project manager and it displays the following: Allocation Details Grid: Displays Resource and its Allocated hours, Available hours and Allocation percentage (Allocated hours/Available Hours) Allocation Percent by Resource: Column chart that displays Allocation Percentage for various resources during the selected Time frame. You can further narrow your search by Project Manager & Month Start Date range.
