-
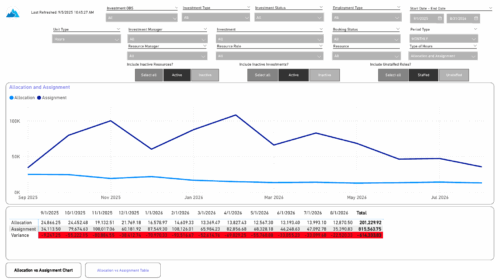 The Investment Allocations and Assignments report provides visibility into team member allocation, task assignment, and variance amounts by investment across time periods. A chart highlights allocation compared to assignment amounts by period. Results can be displayed by week, month, or in total, and viewed in either hours or FTEs for each team member and investment. Interactive visuals make it easy to compare planned effort against actual assignments at the team member and investment level. Content Type: Business Intelligence, PowerBI Report
 -
 Do you want to add interfaces to your CA PPM instance? This class will review the pros and cons of various integration methods and provide best practice on how to handle various interfaces. We’ll walk you through specific interface examples and showcase Rego’s pre-built interface sets you can leverage to reduce the time and cost of implementation.
 -
 The Hours and Cost by Vendor – Grid portlet displays vendor hour or costs by month grouped by vendor. Using this portlet, management is provided with a quick overview of vendor costs or hours by month for a set of time without running a report or navigating to each resource individually. This portlet uses the monthly actual timeslices. The user may filter by vendor, vendor ID, date, and hours/cost in addition to the start/finish and hours/cost. Once populated, the grid will display all vendors that currently have hours/cost for the selected time frame.
 -
The Hours and Cost by Vendor – Grid portlet displays vendor hour or costs by month grouped by vendor. Using this portlet, management is provided with a quick overview of vendor costs or hours by month for a set of time without running a report or navigating to each resource individually. This portlet uses the monthly actual timeslices. The user may filter by vendor, vendor ID, date, and hours/cost in addition to the start/finish and hours/cost. Once populated, the grid will display all vendors that currently have hours/cost for the selected time frame.
-
 The Hours and Cost by Vendor - Graph portlet displays vendor hour or costs by month. Using this portlet, management is provided with a graphical representation of vendor costs or hours by month for a set of time without running a report or navigating to each resource individually. This portlet uses the monthly actual timeslices. Additionally, the user must select a date range and whether to display hours or costs. Once populated, the graph will display all vendors that currently have hours and cost for the selected date range.
 -
The Hours and Cost by Vendor - Graph portlet displays vendor hour or costs by month. Using this portlet, management is provided with a graphical representation of vendor costs or hours by month for a set of time without running a report or navigating to each resource individually. This portlet uses the monthly actual timeslices. Additionally, the user must select a date range and whether to display hours or costs. Once populated, the graph will display all vendors that currently have hours and cost for the selected date range.
-
 The Grant Resources Timesheet Edit Rights process will grant each resource timesheet edit instance rights to his or her own timesheets. This process will not remove any existing timesheet edit instance rights.
 -
The Grant Resources Timesheet Edit Rights process will grant each resource timesheet edit instance rights to his or her own timesheets. This process will not remove any existing timesheet edit instance rights.
-
The Grant Resources Timesheet Edit Rights process will grant each resource timesheet edit instance rights to his or her own timesheets. This process will not remove any existing timesheet edit instance rights.
-
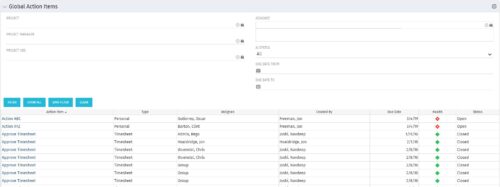 The Global Action Items portlet will help users and clarity admins to keep track of action items in the CA PPM system. This is useful to keep track of Timesheet Approval through Action Item or any other Action Item related workflows. The portlet displays Name, Type Assignee, Created by, Due Date, Health and Status of the Action Items as default columns. The portlet provides Project, Project Manager, Project OBS, Assignee, Status and Due Dates of the Action Items as default filters.


Copyright 2023 • Rego Consulting Corporation • Privacy Policy