-
 The My Resource Vacation portlet allows a resource to view the current logged in users' annual vacation allowance, as set by the resource manager, against the resource vacation calendar hours and actual posted timesheet hours. The portlet is useful for determining the amount of hours a resource has requested off and has remaining. The portlet also ensures the resource has accounted for all annual vacation allowance hours in the calendar and has posted time for all past calendar request hours.
 -
The My Resource Vacation portlet allows a resource to view the current logged in users' annual vacation allowance, as set by the resource manager, against the resource vacation calendar hours and actual posted timesheet hours. The portlet is useful for determining the amount of hours a resource has requested off and has remaining. The portlet also ensures the resource has accounted for all annual vacation allowance hours in the calendar and has posted time for all past calendar request hours.
-
 Monthly Actuals - Admin is a standard calendar view of actuals posted by a user on each day of the selected month. Actuals also includes timesheets that haven’t been submitted/posted yet. Actual hours on the report are tied to user's availability i.e. when user has 0 availability (Saturday/Sunday/Holiday) then actuals are also greyed out.
 -
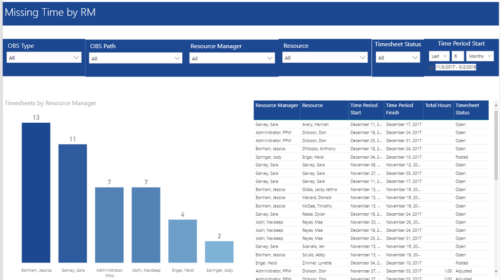 Missing Time by RM report displays Resources whose timesheets are missed by Resource Manager. There is Clustered Column Chart which displays missed timesheets count by Resource Manager. Also, there is table view of Resource Manager, Resource, Time Period Start and Finish Dates, Total Hours and Timesheet status. User can narrow their search by OBS Type & Path, Resource Manager, Resource, Timesheet Status and Time Period Start Date (Relative or Specific Date Range).
 -
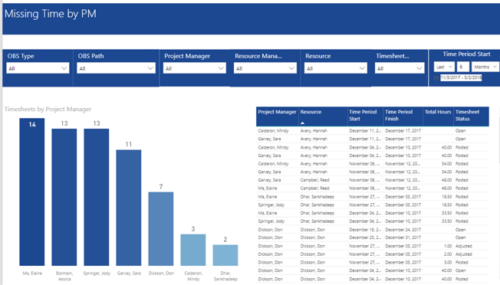 Missing Time by PM report displays Resources whose timesheets are missed by Project Manager. There is Clustered Column Chart which displays missed timesheets count by Project Manager. Also, there is table view of Project Manager, Resource, Time Period Start and Finish Dates, Total Hours and Timesheet status. User can narrow their search by OBS Type & Path and Project Manager, Resource Manager, Resource, Timesheet Status and Time Period Start Date (Relative or Specific Date Range).
 -
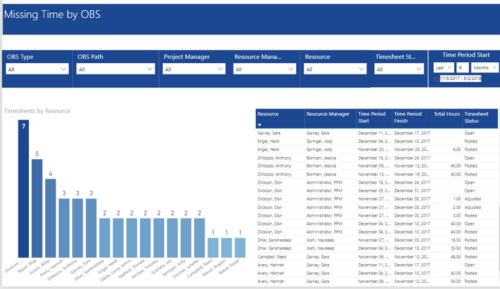 Missing Time by OBS report displays Resource whose timesheets are missed. There is Clustered Column Chart which displays Timesheets count by Resource. Also, there is table view of Resource, Resource Manager, Time Period Start and Finish Dates, Total Hours and Timesheet status. User can narrow their search by OBS Type & Path and Project Manager, Resource Manager, Resource, Timesheet Status and Time Period Start Date (Relative or Specific Date Range).
 -
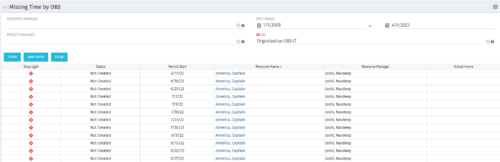 The Missing Time by OBS portlet displays all missing or late timesheets for resources staffed within a specific OBS. Resources will be included if they are open for time entry, have the track mode of ‘Clarity’ and have a timesheet that is not posted. The portlet accommodates for hire and termination dates. Also, the portlet only shows resources that the active user has the security rights to view. Administrators and the Project Management Office may use this portlet to determine the timesheet status of all resources within a specific OBS in open time periods. This portlet allows a user to quickly search by OBS and view all timesheets under that area. After selecting the OBS, the user can also filter on time period start date, Resource Manager and/or Project Manager. The portlet will display a ‘Stop Light’ indicator based on timesheet status, the status, period start, Resource Name, Resource Manager and any actual hours entered for the timesheet.
 -
The Missing Time by OBS portlet displays all missing or late timesheets for resources staffed within a specific OBS. Resources will be included if they are open for time entry, have the track mode of ‘Clarity’ and have a timesheet that is not posted. The portlet accommodates for hire and termination dates. Also, the portlet only shows resources that the active user has the security rights to view. Administrators and the Project Management Office may use this portlet to determine the timesheet status of all resources within a specific OBS in open time periods. This portlet allows a user to quickly search by OBS and view all timesheets under that area. After selecting the OBS, the user can also filter on time period start date, Resource Manager and/or Project Manager. The portlet will display a ‘Stop Light’ indicator based on timesheet status, the status, period start, Resource Name, Resource Manager and any actual hours entered for the timesheet.
-
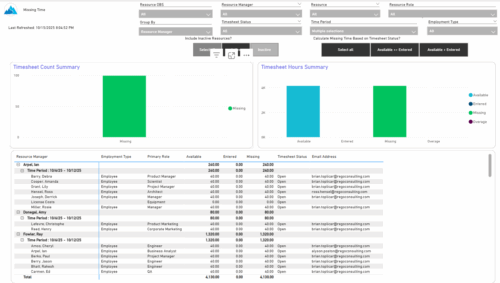 The Missing Time report provides insight into timesheet compliance by comparing available hours, entered hours, and missing hours for each resource over a selected time period. It can be grouped by resource manager or OBS level and offers flexibility to calculate missing time based on timesheet status or resource availability. The report includes summary charts showing timesheet completion rates and total hours, highlighting completed, partial, and missing timesheets as well as overages across reporting periods.
 -
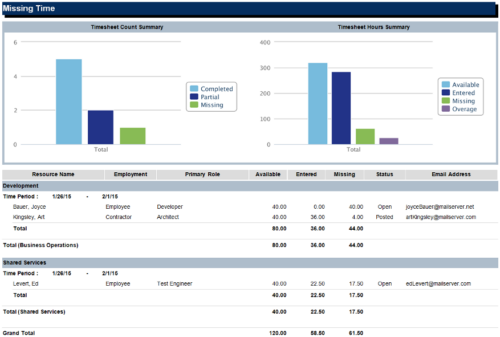 The Missing Time report is a transaction based Jaspersoft report that does not require the Load Jaspersoft Datawarehouse job to be run. The report will pull real-time data from the transaction tables in Clarity. This report can be run from either the Advanced Reporting or Reports and Jobs area within Clarity. The Missing Time report displays resource available hours, timesheet hours entered, and timesheet hours missing by resource and time period. The report can be grouped by resource manager or OBS level. The report also has an option to calculate missing time based on timesheet status or resource availability. The charts include a summary of timesheets across the periods included in the report. The Timesheet Count Summary displays the number of timesheets that are completed, partially completed, or missing for the time periods. The Timesheet Hours Summary displays the number of hours grouped by resource availability, timesheets entered, timesheets missing, and overage.


Copyright 2023 • Rego Consulting Corporation • Privacy Policy