-
 The Auto-Approve Old Timesheets workflow process can be run through the "Execute a Process" job and may be used to quickly close out timesheets for a specified timeframe for period closure. The workflow will execute a query that will automatically approve ALL (no matter the status of the timesheet) timesheets that have a time period start date before the Approve Date specified within the process itself.
 -
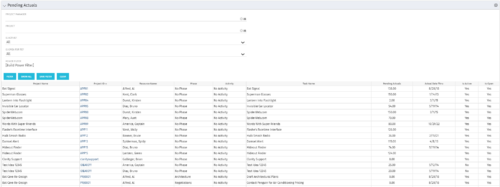 The Pending Actuals portlet displays pending actuals for resources by task. This portlet allows the user to filter on Project, Project Manager, Is Active and Is Open for Time Entry. This portlet provides Resource Managers and Project Managers a simple way to analyse which actuals have been submitted but not posted on specific tasks, as well as the aggregate pending hour total. Note: the information displayed is dependent on what the user has security rights to view.
 -
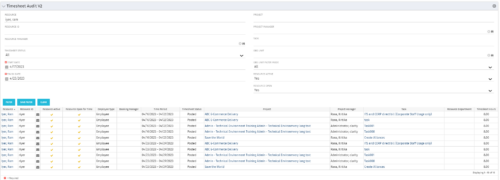 The Timesheet Audit portlet displays timesheet information in order to perform an audit. The only required data needed to search the portlet is start and finish date. Additionally, you may narrow the results by filtering by resource, resource ID, OBS Unit, resource manager, timesheet status, project, and task. The portlet provides reporting on the following:
- Resource
- Resource ID
- Email Icon of Resource (So the reviewer can quickly email the Resource)
- Resource is Active
- Resource Open for Time
- Time Period (Start and Finish Dates)
- Timesheet Status
- Is Adjustment (If the timesheet is adjusted)
- Timesheet Modified Date
- Timesheet Posted Date
- Timesheet Submitted By
- Timesheet Approved By
- Project
- Task
- Proposed ETC Hours
- Pending Actual Hours
- Total Actual Hours
-
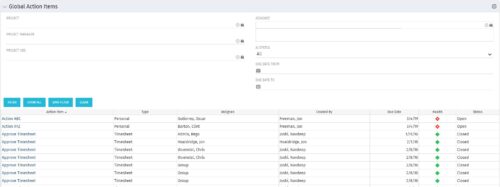 The Global Action Items portlet will help users and clarity admins to keep track of action items in the CA PPM system. This is useful to keep track of Timesheet Approval through Action Item or any other Action Item related workflows. The portlet displays Name, Type Assignee, Created by, Due Date, Health and Status of the Action Items as default columns. The portlet provides Project, Project Manager, Project OBS, Assignee, Status and Due Dates of the Action Items as default filters.
 -
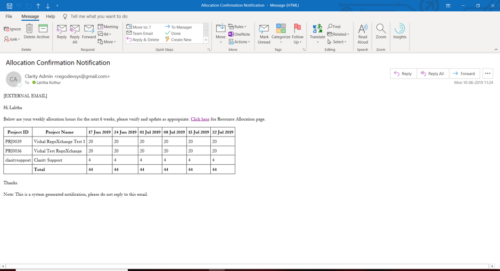 A Process run via Execute a Process job; sends an email to active resources, containing a facsimile of their Resource Allocation Detail page. It shows the next six weeks of allocations by investment, with a column total. The email also contains a click here link to this page in CA PPM, to enable editing of the data, as appropriate.
 -
 Course Description: Are you struggling to implement Agile tools at your organization alongside Clarity PPM? This class will review best practices for implementing Agile tools in conjunction with Clarity PPM while living in a bimodal world. We will discuss how Clarity PPM can govern both types of work and teams and how Agile tools should interface with Clarity PPM.
 -
 Is there a way to simplify time tracking? Time is a function 90% of companies use. What are ways to have time be less of a burden to users? How can you minimize the negative perception? This session will discuss options within CA PPM or outside CA PPM to make time tracking less of a burden for all.
 -
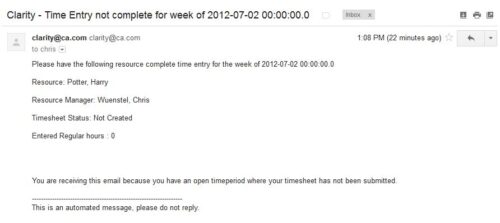 The Time Tracking Stalker – Resource workflow process is used to notify resources that fail to submit a timesheet in a prior week. The workflow checks for active resources, hire/termination dates, track mode, and open for time entry. This process helps to ensure resources submit timesheets in a timely manner. In version 13, the email can be enhanced to include colors, bold, underline, and other HTML formatting.
 -
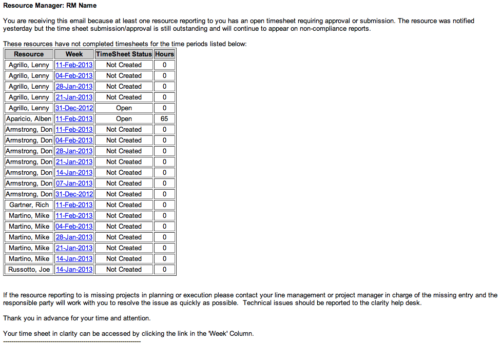 The Time Tracking Stalker - RM workflow process automatically sends an email to Resource Managers for each one of their resources that have not submitted their timesheet for a prior open time period, thus informing the RM if their resources are submitting their timesheets on time. Project Managers will also benefit since the notifications will help to ensure that time is being posted against their projects in a timely manner, helping to provide them with an accurate view of time expended on the projects.
 -
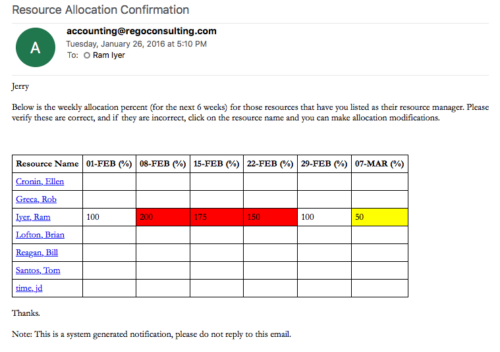 Process sends an email to RM, for resources assigned, that indicates the allocation percentage for each resource for the next 6 weeks. Email has links to each resource so that allocation modifications can be made as required.
 -
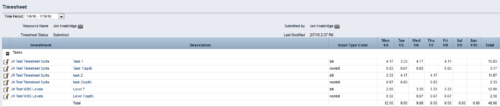
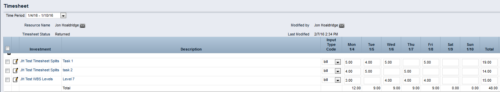 The Timesheet Smoothing Process Workflow kicks-off when an individual timesheet is Submitted. It splits each transaction on the timesheet when total timesheet actuals exceed total weekly availability for the resource. Total weekly availability is determined by multiplying resource availability rate by the number of workdays in the week. Non-workdays include weekends, holidays, PTO, and other scheduled days off, as set on the resource calendar. If timesheet actuals <= total weekly availability, then the timesheet remains unchanged. But if timesheet actuals > total weekly availability, then the following occurs. Each timesheet transaction is reduced by a calculated percentage that will reduce the total regular hours to equal the total weekly availability. Then the remaining transaction hours are placed in a “Split” row for that task on that day, with an Input Type Code set based on a process parameter (which parameter can be set within the script action on the process). Note: If a single day has overtime hours, but the total timesheet actuals <= total weekly availability, no splitting occurs.
 -
 This video covers the process of accessing timesheets within Clarity, both as a team member and as a Project or Resource Manager.


Copyright 2023 • Rego Consulting Corporation • Privacy Policy