-
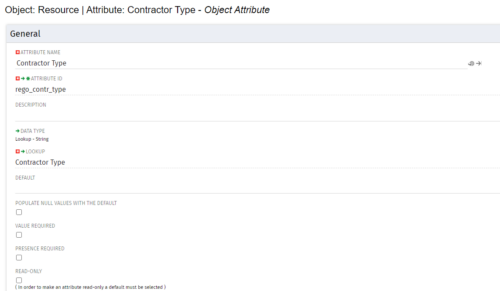
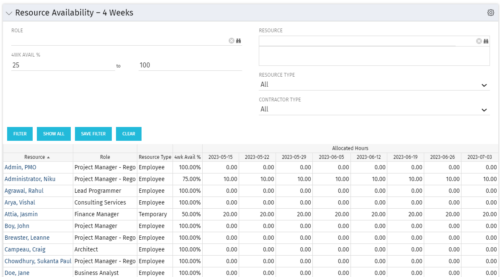 Resource Availability – 4 Weeks is a grid portlet that displays all resources with their total allocated hours by week, and an average availability percent (4 Wk Avail %) for next four weeks. If % Available is negative, this indicates an over-allocation. Zero% Average Availability indicates fully allocated (no remaining availability). Filterable by Role, Resource, Resource Type, Full-Time/Part-Time, Availability Range. Contractor Type is a custom attribute (Lookup - String) created on the Resource object. It is attached to the lookup, Contractor Type (Lookup ID: REGO_CONTRACTOR_TYPE) that has static values Part Time (PT) and Full Time(FT).
 -
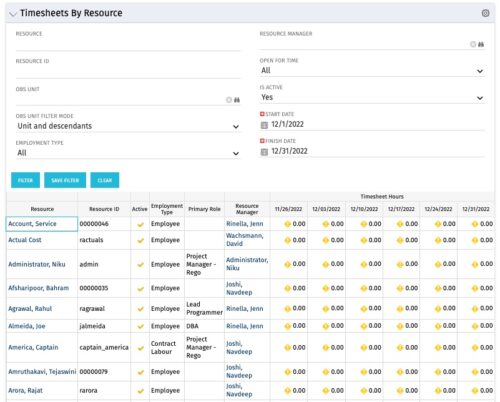 The Timesheets by Resource portlet gives the ability to highlight the time periods where resources are working overtime or working less than 25 hours a week. The filter requires timesheet Start Date and End Date to be provided. Additionally, the information can be filtered by Resource, Resource ID, OBS Unit, Employment Type, Resource Manager, Open for Time, and Active status. This portlet displays Resource, Resource ID, Active (yes/no), Employment Type, Primary Role, Resource Manager, and Timesheet Hours Flag. The flags are set with the logic
- Yellow = timesheets not posted / zero hour timesheets
- Green = where number of hours posted is > 25 and less than 45
- Red = where number of hours posted is < 25 or > 45
-
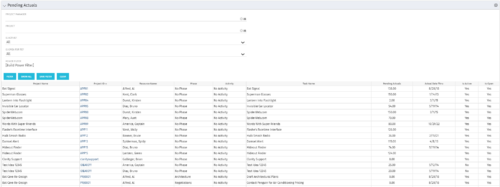 The Pending Actuals portlet displays pending actuals for resources by task. This portlet allows the user to filter on Project, Project Manager, Is Active and Is Open for Time Entry. This portlet provides Resource Managers and Project Managers a simple way to analyse which actuals have been submitted but not posted on specific tasks, as well as the aggregate pending hour total. Note: the information displayed is dependent on what the user has security rights to view.
 -
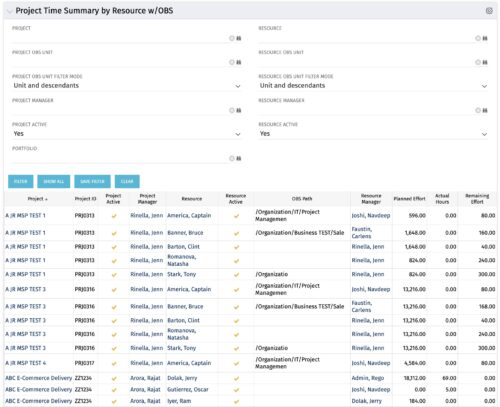 The purpose is to show actual hours, planned effort and remaining effort at the resource level, with the addition of OBS levels to support filtering and manipulation of the exported data.
 -
 The Time by Stage portlet displays time logged to each project task stage. The portlet displays the project id, project name, task stage, and charge code for each different task stage on the project. This portlet provides management with a quick view of all project task stages by project without having to navigate into each project individually.
 -
 The Time By Type - Pie Chart portlet is a graphical representation of time by type of investment for all resources the logged in user has security rights to view. This portlet pulls from the daily timeslices, and can be used for determining what types of projects receive the majority of hours. The filter option allows for entry of a specific start date and finish date.
 -
 This training document is a Rego Consulting Quick Reference Guide to assist with Entering and Submitting Time in Clarity’s Modern User Experience. This doc references version 16.1 views. Document includes Accessing & Selecting Timesheets, Populate Timesheet, Updating Timesheet, Submitting Timesheet and Entering Time for Someone Else.
 -
 This training document is a Rego Consulting Quick Reference Guide to assist resource managers with the approval of timesheets via the Review & Approve tab. This doc references version 16.1 views. Doc reviews accessing and selecting timesheets, reviewing submitted timesheets, approving timesheets, approving multiple timesheets, returning timesheets and the timesheet grid.
 -
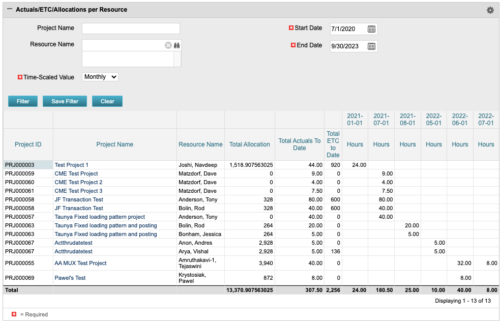 The portlet displays posted time by project for the logged in user based on time period and date range. This allows the user to see at a glance their ETC and actuals on the projects. The portlet displays the Total Allocation and Total Actuals to Date for the user on the projects they are allocated/assigned to. The actuals are displayed per month in the form of TSVs.
 -
 This portlet displays Actual Time by Project over a span of time. It supports Annual, Quarterly, Monthly, and Weekly time periods. The time span displayed is controlled by a filter field for the Start Date (of the time span) and by a filter field for the Number of Time Periods to be displayed. There are also filters for Project name, Project Manager, and Project Type.
 -
 This portlet pulls back the Availability and Allocation totals by Role between a user-specified Start and Finish Date, then the user can drilldown to look at the information for Applications. The Time Period filter allows for comparing these values across different timeframes (monthly, weekly, quarterly, annual) as desired. Other filters allow for looking at Active or Inactive Roles (or both) and including Active or Inactive Projects (or both) in the totals.
 -
 This training document is a Rego Consulting Quick Reference Guide to assist resource managers with the adjusting of timesheets. This doc references version 16.0.3 views. Document provides guidance on how to use the Review & Approve tab to adjust time that has already been entered by a resource.


Copyright 2023 • Rego Consulting Corporation • Privacy Policy