-
 The Grant Edit Time to Proxy process utilizes the proxy feature within Clarity to assign timesheet edit rights to a proxy for any resources that the user is the current resource manager for. The process, when run, will also remove any timesheet edit rights for any users if the proxy has been removed or the resource manager has changed. This process would allow a resource manager to designate a subordinate the ability to enter time on other resources’ behalf while still going to the resource manager for approval.
 -
 The Grant Edit Skill and Calendar workflow process grants the ability for resources to edit both the skill and calendar sections for their record. This workflow simplifies the task or updating a resource’s calendar or skill set by the user to update any new skills or new time off requests he or she is planning.
 -
 The Grant Approve Time to Proxy process utilizes the proxy feature within Clarity to assign timesheet approval and edit rights to a proxy for any resources that the user is the current resource manager for. The process, when run, will also remove any timesheet approval and edit rights for any users if the proxy has been removed or the resource manager has changed. This process is used for resource managers that will be out of the office.
 -
 This portlet displays the % allocation of resources to projects. The portlet shows if the resource is allocated to the projects as an individual resource or as part of an Agile team, in which case it will display the resource % allocation to the team and what that will represent in terms of % allocation to the project. The Total Allocation % display the allocation of the resource to all investments is allocated to. Remaining Capacity and Over/Under columns will help identify the resources that still have availability and the ones that are over allocated.
 -
 The Resources Demand Summary portlet displays the total Estimate to Complete (ETC’s) for Resources. The portlet displays the total per time scale value selected per resource and a grand total of all ETC’s for the selected time period. Filtering capabilities allow the user to filter by an individual resource, resource manager, time scale values, dates, and OBS. The portlet provides a Resource Manager with a single location to view ETC’s by Resource.
 -
The Resources Demand Summary portlet displays the total Estimate to Complete (ETC’s) for Resources. The portlet displays the total per time scale value selected per resource and a grand total of all ETC’s for the selected time period. Filtering capabilities allow the user to filter by an individual resource, resource manager, time scale values, dates, and OBS. The portlet provides a Resource Manager with a single location to view ETC’s by Resource.
-
 The Timesheet Notes portlet displays all timesheet notes split out by resource, investment and task. This is very useful in situations where you want to review multiple notes as you do not have to open each note separately. The table below describes the available filter fields in the portlet.
Column Label Description Timesheet Period Start Range of time periods to display filtered by start date Timesheet Period Finish Range of time periods to display filtered by finish date Resource Resource(s) to display Type Note on a timesheet or time entry (task specific) -
The Timesheet Notes portlet displays all timesheet notes split out by resource, investment and task. This is very useful in situations where you want to review multiple notes as you do not have to open each note separately. The table below describes the available filter fields in the portlet.
Column Label Description Timesheet Period Start Range of time periods to display filtered by start date Timesheet Period Finish Range of time periods to display filtered by finish date Resource Resource(s) to display Type Note on a timesheet or time entry (task specific) -

This portlet displays the monthly allocation per resource. The PM can view by the RM or the resource to get the data for monthly resource allocations. The table below describes the available filter fields in the portlet. Column Label Description Work Effort Manager Manager of the Investment the Work Effort is on Work Effort Active Active status of the Investment the Work Effort is on Resource Resource’s Name Internal Resource ID Resource’s ID Zero Allocation Show Allocations that equal zero Open for Time Entry Is the Resource Open for Time Entry Resource Active Resource’s Active status Role Resource’s Primary Role OBS Unit Resource’s OBS Start Allocation Start Time to filter by End Allocation Finish time to filter by -
 This Portlet produces a Grid View of Resources using total Resource Allocation from each Project’s Team / Staff, per month; output is expressed as a %. Users can specify which Resource OBS to use as a Filter (unit and descendants is assumed) as well as a Start/End Date.
 -
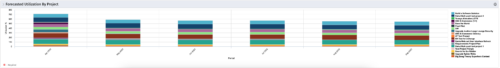 This Portlet produces a Stacked Chart of Projects using total Resource Allocation from each Project’s Team / Staff, per month. Users can specify which Resource OBS to use as a Filter (unit and descendants is assumed) as well as a Start/End Date Range.
 -
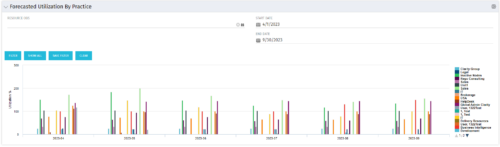 This Bar Chart Portlet displays a vertical bar for every Practice (Resource OBS) per Month. The bar represents the Utilization % (Resource Allocations divided by Resource Availability). Filters are provided for Resource OBS (Units and Descendants) and the date range to be displayed.


Copyright 2023 • Rego Consulting Corporation • Privacy Policy