-

 The Capacity Graph portlet displays Availability, Allocations, Actuals and Assignments for one or more active resource(s) in a single view. This portlet pulls data from timeslices, and allows the user to filter on a weekly, monthly or quarterly data. The Estimated Time to Complete (ETC) and Allocation data will only show for projects that are active. This portlet provides Resource Managers, PMOs and Executives with a simple way to analyse: Allocations vs. Availability, Allocations vs. Actuals, Allocations vs. ETC and ETC vs. Availability. The graph allows the user to determine where areas of improvement may exist and quickly identify potential areas of constraint. Note: the information displayed is dependent on what the user has security rights to view.
 -
The Capacity Graph portlet displays Availability, Allocations, Actuals and Assignments for one or more active resource(s) in a single view. This portlet pulls data from timeslices, and allows the user to filter on a weekly, monthly or quarterly data. The Estimated Time to Complete (ETC) and Allocation data will only show for projects that are active. This portlet provides Resource Managers, PMOs and Executives with a simple way to analyse: Allocations vs. Availability, Allocations vs. Actuals, Allocations vs. ETC and ETC vs. Availability. The graph allows the user to determine where areas of improvement may exist and quickly identify potential areas of constraint. Note: the information displayed is dependent on what the user has security rights to view.
-
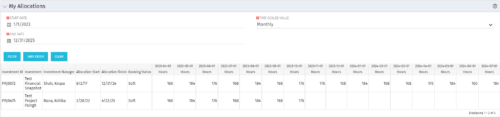 The My Allocations portlet will display the allocations for the logged in user - pulling data from the timeslices. It is used as a quick reference for the users to view their allocations across all of the projects where their allocation is greater than 0 for the specified date range the user wants. This will display both active and inactive projects.
 -
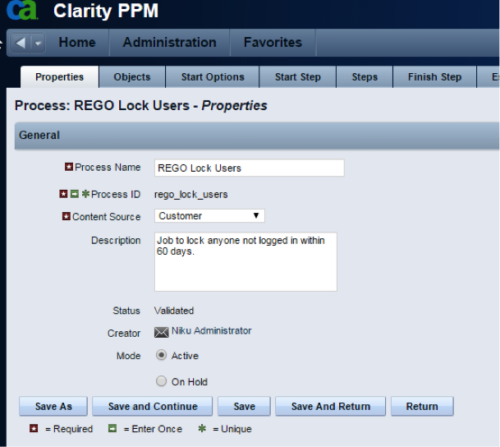 The Lock Inactive Users workflow process will automatically lock all user accounts when their last login date was more than 60 days ago. The process can be scheduled to run daily or can be run on demand when resource account cleanup is needed.
 -
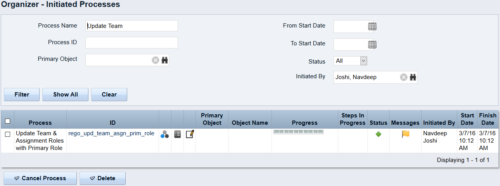 This process updates the team, assignment and timesheet roles with the primary role where they do not match. This way, the PM can push all roles to team and assignment for that project before they do a cost plan.
 -
 Resource Management - Are You Doing it Right? Companies of all shapes and sizes need to know if they have the right people working on the right things at the right time, to meet their objectives. Rego's own Grant Zemont has put together this report to help your company learn the best practices for setting up a resource management office correctly. Download the free report here. This White Paper is downloaded from the Rego Consulting site. You will be asked to provide your email address and current ppm tool. - http://info.regoconsulting.com/rmo-report ** Do not Add to Cart - No Downloadable File**
 -
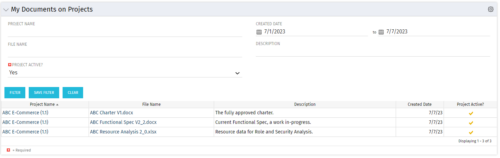 This Portlet allows users to quickly access Documents they uploaded into Projects via the Classic UI à Collaboration tab or via the New UX Documents module. Clicking on the File Name downloads the file, clicking on the Options gear allows users to export the list to Excel.
 -
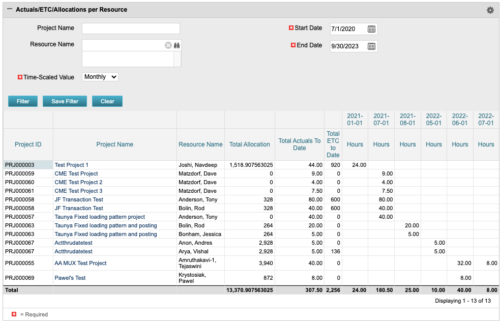 The portlet displays posted time by project for the logged in user based on time period and date range. This allows the user to see at a glance their ETC and actuals on the projects. The portlet displays the Total Allocation and Total Actuals to Date for the user on the projects they are allocated/assigned to. The actuals are displayed per month in the form of TSVs.
 -
 Does your organization struggle with resource management? Have you considered creating a Resource Management Office (RMO)? DO you struggle with a lack of Executive sponsorship to drive adoption? This session will review how some organizations are succeeding in driving adoption and effectively manage resources through engaging leadership, RMOs, and using more dedicated resources. Learn about some best practices for driving effective resource management across your organization.
 -
 This training document is a Rego Consulting Quick Reference Guide to assist with the adding of resources to the Staff tab for Ideas in Clarity’s Modern User Experience. This doc references version 16.1.2 views. Document provides detail on how to add resources to the Staff tab, Default Allocation % and Per-Period metrics.
 -
 This training document is a Rego Consulting Quick Reference Guide to assist with Staff Grid in Clarity’s Modern User Experience. This doc references version 16.1.2 views. Document provides detail on the use of the Staff Grid in the Staffing Modules in the Common Component functionality.
 -
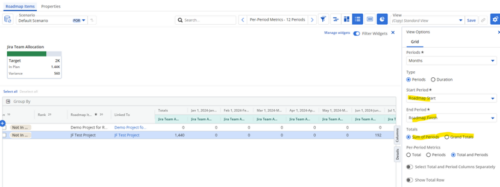
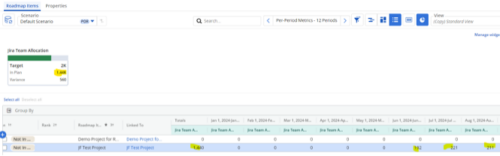 Capture and present allocation data by Team for the Investments included in your Roadmap to enable the ability to compare to Targets or Limits. Allocation data can be presented in Hours or FTE, for Teams Only.


Copyright 2023 • Rego Consulting Corporation • Privacy Policy