-
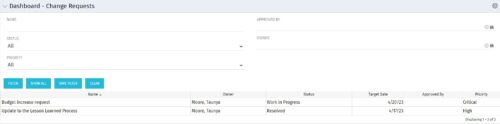 The Dashboard: Change Requests portlet gives an overview of all change requests on the project. The portlet will pull the "id" from the page it is placed on, so this portlet is usually placed on the project dashboard tab. The portlet sorts the issues first by priority and then by target date. It displays the name, owner, status, target date, approved by, and the priority.
 -
 This training document is a Rego Consulting Quick Reference Guide to assist with the adding of resources to the Staff tab for Ideas in Clarity’s Modern User Experience. This doc references version 16.1 views. Document provides detail on how to add resources to the Staff tab, Default Allocation % and Per-Period metrics.
 -
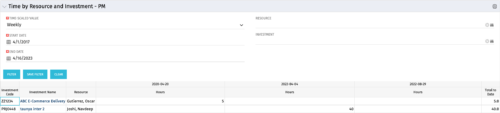 The Time By Resource and Investment - PM portlet shows time spent on projects where the logged in user is the project manager. This portlet is used to get a snapshot of investments and the time that has been put against them at the individual resource level for the projects that user has access to. This portlet is used for determining what resources have put time against specific investments and can be used to see where resources are spending their time or to help rationalize ETCs for remaining work for planning purposes. The portlet may be filtered by time-scale, date, resource or investment to narrow the search results.
 -
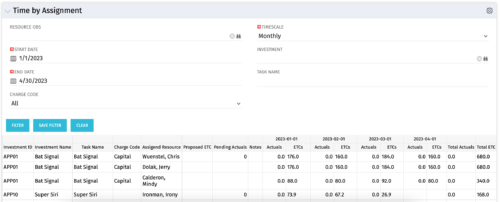 The Time by Assignment portlet displays time logged to assignments for all investments the logged in user has security rights to view - pulling data from the timeslices. It is capable of displaying the data by weekly, monthly or quarterly segments. The portlet may also be filtered by investment and resource OBS.
 -
 The Resource Data Issues portlet is used to identify data exceptions related to resource setup. This portlet helps to identify where resources are missing key data or are possibly sitting in an exception state. This view will show resources that have one or many exceptions, including inactive resources. There is no security built into this portlet - all resources will show. The only required field in the filter is Days, which is the number of days since the user last logged in. The user may also narrow the results by resource, OBS, or project type.
 -
 The Allocation Compliance by Resource (Resource Manager) portlet gives a view of resource allocation compliance for all active resources the logged in user is the Resource Manager for. It allows the RM to see resources they manage over the coming months and whether they are over or under allocated. This portlet leverages the daily allocation and daily availability slices as well as only active investments. The portlet provides filters for specific dates, filtering by resource ID, and resource name may also be added.
 -
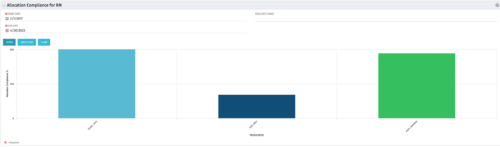
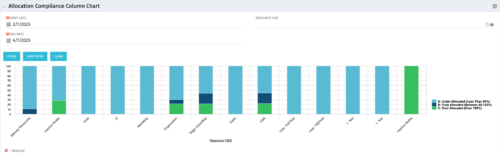 This view depicts Allocation Compliance for resources grouped by OBS. Using the daily Resource Availability and Daily Resource Allocation Time Slices this column chart groups aggregate Allocation vs Availability by OBS Unit. The chart allows quick analysis to see if resources are adequately allocated (between 80% to 120% of their capacity) or if they are significantly under or over allocated. NOTE: The grouping of OBS unit is limited to 1 level below the selected OBS in the portlet filter.
 -
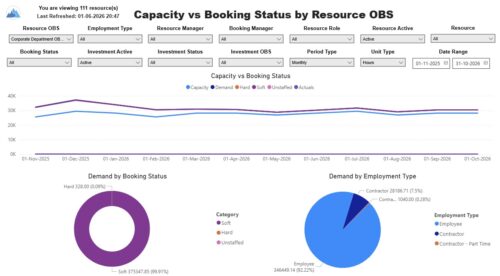 The Capacity vs. Booking Status by OBS report includes three charts. The line chart displays capacity compared to demand, with demand distributed by booking status, and actuals by period. The pie charts display demand by booking status and demand by employment type. The report also includes a detail listing of resource capacity and demand at the booking status level across investments. The report can be grouped by any OBS level, providing visibility into resources at any level of the organization. The report displays amounts by week or month, and in total. The amounts can be displayed as hours or FTEs. Report Prerequisites Verify that you have completed the following prerequisites before you run this report: • Resource capacity amounts display if the resource has availability that is defined and meets the parameter criteria. • Resource demand allocation amounts display if the resource is allocated to at least one investment. Resource assignments are not required. • The Load Data Warehouse job must be run before you run this report. If the Data Warehouse is not populated, the report will not display any data. Also, most of the report parameters do not display options.
 -
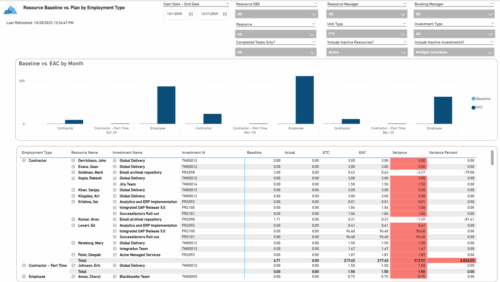 The Resource Baseline vs. Plan by Employment Type report provides insight into how resource utilization compares to the original baseline. It displays baseline, actual, estimate, and variance values for each resource across investments, grouped by employment type—such as employees or contractors. The report includes monthly charts that compare baseline amounts to estimated-at-completion values, with data shown in either hours or full-time equivalents (FTEs). This enables clear visibility into performance and variances by employment category.
 -
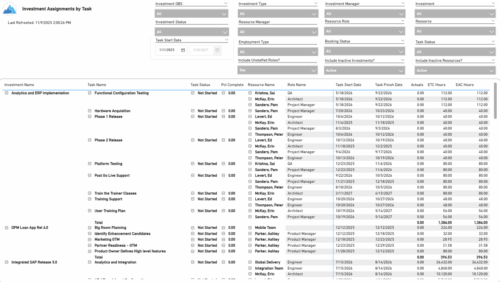 The Investment Assignments by Task report provides a detailed breakdown of effort at the task-assignment level for each investment. It displays both actuals and estimates for resource assignments, along with task status, percent complete, and assignment start and finish dates. Totals are available at the investment level, making it easy to analyze workload, progress, and effort distribution across tasks and resources.
 -
 Today's workforce is more diverse than ever, and a "one size fits all" approach to leadership is seldom effective. A remote/hybrid workforce presents unique challenges, and teams often represent many different generations each with unique characteristics and needs. Even if you are not in a formal leadership position, we all are responsible for reflecting leadership skills and traits that encourage a collaborative spirit where everyone can bring the best version of themselves to their efforts. We'll offer some insights and opportunities that will help you and your teams to thrive.
 -
 This training document is a Rego Consulting Quick Reference Guide to assist resource managers with the adjusting of timesheets. This doc references version 16.1.2 views. Document provides guidance on how to use the Review & Approve tab to adjust time that has already been entered by a resource.


Copyright 2023 • Rego Consulting Corporation • Privacy Policy