-
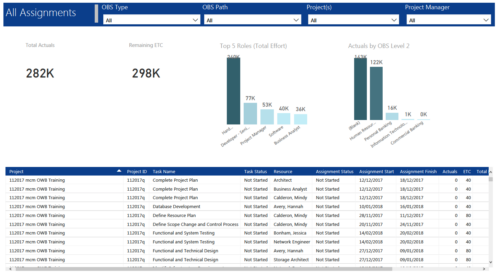 All Assignments report provides project managers a single place to view KPIs related to Task Assignments. All the KPIs are depicted in various visualizations. Total Actuals: Scorecard that displays the sum of actuals associated with assignments for the selected criteria. Remaining ETC: Scorecard that displays the sum of current ETC associated with assignments for the selected criteria. Top 5 Roles (Total Effort): Column chart that displays Effort (Actuals + ETC) by Roles. X axis displays various Roles. Data labels indicate sum of effort associated with that Role. Actuals by OBS level 2: Column chart that displays Actuals by OBS level 2. X axis displays various OBS level 2. Data labels indicate sum of actuals associated with that OBS. Grid: Displays Assignment details such as Project ID, Project Name, Task Name, Task Status, Assigned Resource, Assignment Status, Assignment Start, Assignment Finish, Actuals, ETC, Total Effort, Days Late and Days Old. You can further narrow your search by OBS Type, OBS Path, Project(s) and Project Manager.
 -
 Actuals & ETC by Resource Assignment report provides project managers a single place to view Actuals and ETC associated with resources across multiple Tasks and Projects. It displays the following: Actual and ETC Hours by Start Date: Stacked Column chart that displays the total Actual hours and ETC hours per month of fiscal period. Grey color indicates Actuals and Purple indicates ETC hours during that month. Grid: Displays Investment name, Task, Assigned resource ETC and Actual hours per month of fiscal period. It also displays aggregated column and row totals for Actuals and ETC hours. You can further narrow your search by OBS Type, OBS Path & Start Date range.
 -
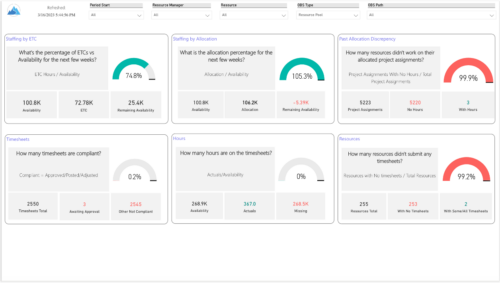 Evaluate resource allocations, identify bottlenecks, and ensure optimal resource utilization across projects and teams. Report Views include: • Allocation Discrepancies • Resource Detail • Resource Skills • Resource Summary • Resource Tasks • Staffing Allocations • Staffing ETC Demo Video - https://www.youtube.com/watch?v=0Rzwl1-jbck&list=PLXJ5ktuWV0jiS9CvBpHvBIwpKPmA9uvwK&index=6
 -
 This training document is a Rego Consulting Quick Reference Guide to assist with utilization of the Staffing page in Clarity’s Modern User Experience. This doc references version 16.2.1 views. Document provides detail on the layout and capabilities of the Staff Grid as well as the Allocations Timeline. Information is provided on columns, widgets and filtering. Instructions are provided on how to save Views. Summary information is provided on the layout of the Allocation Timeline and includes detail on the Investment Timeline and the Resource Histogram. Investment Timeline summary contains information on the Allocations by Investments and the Allocations by Resources tabs. While the Resource Histogram section provides screenshots on Resource Availability and Resources by Role.
 -
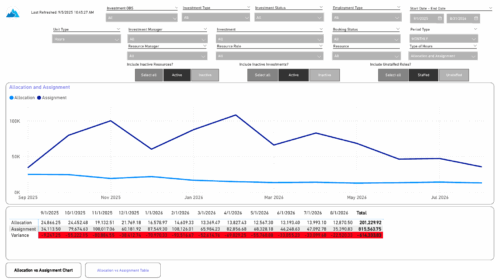 The Investment Allocations and Assignments report provides visibility into team member allocation, task assignment, and variance amounts by investment across time periods. A chart highlights allocation compared to assignment amounts by period. Results can be displayed by week, month, or in total, and viewed in either hours or FTEs for each team member and investment. Interactive visuals make it easy to compare planned effort against actual assignments at the team member and investment level. Content Type: Business Intelligence, PowerBI Report
 -
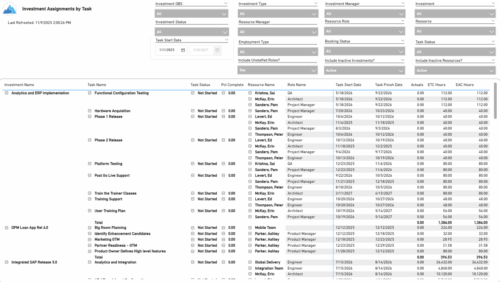 The Investment Assignments by Task report provides a detailed breakdown of effort at the task-assignment level for each investment. It displays both actuals and estimates for resource assignments, along with task status, percent complete, and assignment start and finish dates. Totals are available at the investment level, making it easy to analyze workload, progress, and effort distribution across tasks and resources.
 -
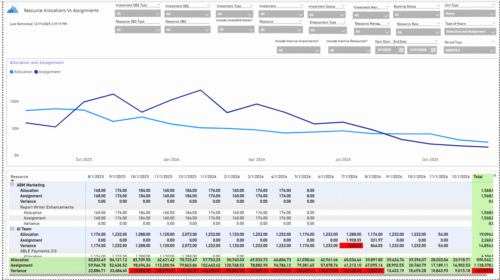 The Allocations and Assignments report displays resource assignments and allocations across multiple projects. This report will provide a single view of the assigned data for all assignments across multiple projects in-line with their allocations. The data is displayed by monthly periods. The horizontal and vertical sums provide a cumulative picture resource wise and month wise respectively. Filters provide the user the ability to monitor data across multiple projects. Filters include investment type, investment, resource, active/inactive resource or investment along with OBS type and OBS unit. If multiple projects are utilizing the same resource, the PM or RM can filter for assignments/allocations utilizing that specific resource to prevent over-allocations or under-allocations.
 -
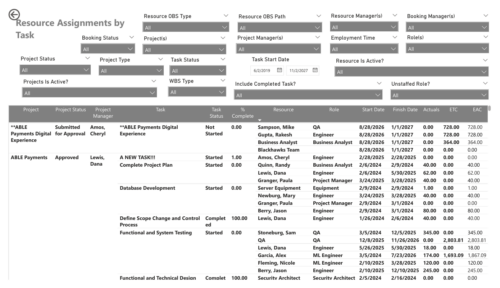 The Resource Assignments by Task report delivers a detailed view of effort distribution for resources working on investment tasks. It outlines both recorded and projected effort at the task assignment level, along with total effort per resource. In addition, the report includes key task details such as progress status, percentage of completion, and assignment start and end dates. This information helps stakeholders monitor workload distribution, track task progress, and evaluate how resource effort aligns with project expectations.


Copyright 2023 • Rego Consulting Corporation • Privacy Policy