-
 Actuals & ETC by Resource Assignment report provides project managers a single place to view Actuals and ETC associated with resources across multiple Tasks and Projects. It displays the following: Actual and ETC Hours by Start Date: Stacked Column chart that displays the total Actual hours and ETC hours per month of fiscal period. Grey color indicates Actuals and Purple indicates ETC hours during that month. Grid: Displays Investment name, Task, Assigned resource ETC and Actual hours per month of fiscal period. It also displays aggregated column and row totals for Actuals and ETC hours. You can further narrow your search by OBS Type, OBS Path & Start Date range.
 -
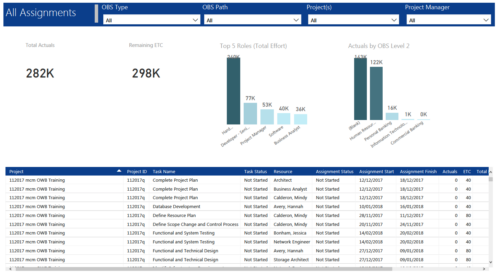 All Assignments report provides project managers a single place to view KPIs related to Task Assignments. All the KPIs are depicted in various visualizations. Total Actuals: Scorecard that displays the sum of actuals associated with assignments for the selected criteria. Remaining ETC: Scorecard that displays the sum of current ETC associated with assignments for the selected criteria. Top 5 Roles (Total Effort): Column chart that displays Effort (Actuals + ETC) by Roles. X axis displays various Roles. Data labels indicate sum of effort associated with that Role. Actuals by OBS level 2: Column chart that displays Actuals by OBS level 2. X axis displays various OBS level 2. Data labels indicate sum of actuals associated with that OBS. Grid: Displays Assignment details such as Project ID, Project Name, Task Name, Task Status, Assigned Resource, Assignment Status, Assignment Start, Assignment Finish, Actuals, ETC, Total Effort, Days Late and Days Old. You can further narrow your search by OBS Type, OBS Path, Project(s) and Project Manager.
 -

A presentation slide deck from Rego University 2022. This document reviews the best practices for resource management in Clarity. - Implementation
- Availability
- Allocation
- Assignment
- Reporting
- Notification
- Data Maintenance
-
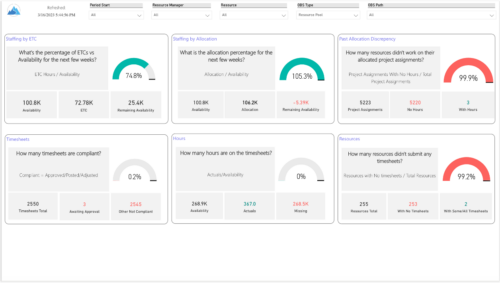 Evaluate resource allocations, identify bottlenecks, and ensure optimal resource utilization across projects and teams. Report Views include: • Allocation Discrepancies • Resource Detail • Resource Skills • Resource Summary • Resource Tasks • Staffing Allocations • Staffing ETC Demo Video - https://www.youtube.com/watch?v=0Rzwl1-jbck&list=PLXJ5ktuWV0jiS9CvBpHvBIwpKPmA9uvwK&index=6
 -
 This training document is a Rego Consulting Quick Reference Guide to assist with utilization of the Staffing page in Clarity’s Modern User Experience. This doc references version 16.2.1 views. Document provides detail on the layout and capabilities of the Staff Grid as well as the Allocations Timeline. Information is provided on columns, widgets and filtering. Instructions are provided on how to save Views. Summary information is provided on the layout of the Allocation Timeline and includes detail on the Investment Timeline and the Resource Histogram. Investment Timeline summary contains information on the Allocations by Investments and the Allocations by Resources tabs. While the Resource Histogram section provides screenshots on Resource Availability and Resources by Role.
 -
 This training document is a Rego Consulting Quick Reference Guide to assist with Task Assignments in Clarity’s Modern User Experience. This doc references version 16.1 views. Document provides detail on how to use the Assignments tab to add resources to tasks, tips on how to group resource data, updating ETC values and Per-Period Metrics.
 -
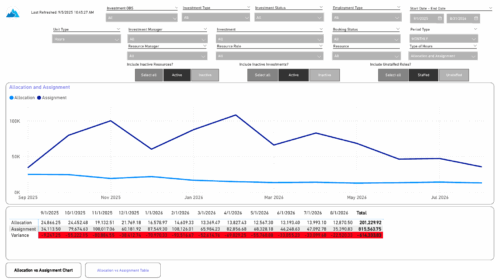 The Investment Allocations and Assignments report provides visibility into team member allocation, task assignment, and variance amounts by investment across time periods. A chart highlights allocation compared to assignment amounts by period. Results can be displayed by week, month, or in total, and viewed in either hours or FTEs for each team member and investment. Interactive visuals make it easy to compare planned effort against actual assignments at the team member and investment level. Content Type: Business Intelligence, PowerBI Report
 -
 Do you want to understand the OOTB configuration and functionality of resource management? In this class, we will review the OOTB objects, views, and functions of assignments, allocations, and other related areas. We will cover both classic and new UX highlighting differences.
 -

 The Capacity Graph portlet displays Availability, Allocations, Actuals and Assignments for one or more active resource(s) in a single view. This portlet pulls data from timeslices, and allows the user to filter on a weekly, monthly or quarterly data. The Estimated Time to Complete (ETC) and Allocation data will only show for projects that are active. This portlet provides Resource Managers, PMOs and Executives with a simple way to analyse: Allocations vs. Availability, Allocations vs. Actuals, Allocations vs. ETC and ETC vs. Availability. The graph allows the user to determine where areas of improvement may exist and quickly identify potential areas of constraint. Note: the information displayed is dependent on what the user has security rights to view.
 -
The Capacity Graph portlet displays Availability, Allocations, Actuals and Assignments for one or more active resource(s) in a single view. This portlet pulls data from timeslices, and allows the user to filter on a weekly, monthly or quarterly data. The Estimated Time to Complete (ETC) and Allocation data will only show for projects that are active. This portlet provides Resource Managers, PMOs and Executives with a simple way to analyse: Allocations vs. Availability, Allocations vs. Actuals, Allocations vs. ETC and ETC vs. Availability. The graph allows the user to determine where areas of improvement may exist and quickly identify potential areas of constraint. Note: the information displayed is dependent on what the user has security rights to view.
-
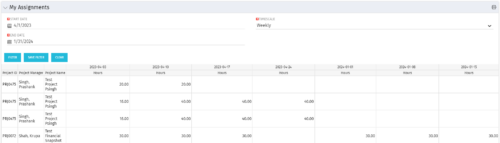 The My Assignments portlet will display the assignments for the logged in user - pulling data from the timeslices. It is used as a quick reference for the users to view their assignments across all of the projects. The portlet also displays work posted against the task, expressed in Actuals, and remaining work to be done, expressed as an Estimate to Complete (ETC). The Effort Variance reflects what the ETC variance is compared to the last current baseline of the project.
 -
 The Capacity Graph - Investment portlet displays Availability, Allocations, Assignments and Actuals for active resources in a single project. This portlet pulls from timeslices and allows the user to filter on weekly, monthly, or quarterly data. This portlet provides a Project Manager with a simple way to analyse: Allocations vs. Actuals and Allocations vs. ETC. Depending on metric goals, the graph allows the user to determine where areas of improvement may exist.
 -
 The All Assignments portlet displays resource assignments across multiple projects. Currently, assignment information displayed for the project, in OWB, or MSP is limited to a single project. This portlet will provide a single view of the assigned data for all assignments across multiple projects. The portlet displays project actuals and estimates from the project (datamart tables). The Days Late field is calculated by the baseline date, while the Days Old field is calculated by today's date. Note: Only the projects that the user has viewer rights to will show up in the list. Filters provide the PM, RM, and individual resource the ability to monitor work progress across multiple projects. For example: ~ PMs can filter for all assignments that were to be completed by a given date but still have "Started" or "Not Started" status. ~ If multiple projects are utilizing the same resource, the PM or RM can filter for assignments utilizing that specific resource to prevent over-utilization. ~ A resource may filter for all assignments assigned to them, providing a picture of their total body of work.
 -
The All Assignments portlet displays resource assignments across multiple projects. Currently, assignment information displayed for the project, in OWB, or MSP is limited to a single project. This portlet will provide a single view of the assigned data for all assignments across multiple projects. The portlet displays project actuals and estimates from the project (datamart tables). The Days Late field is calculated by the baseline date, while the Days Old field is calculated by today's date. Note: Only the projects that the user has viewer rights to will show up in the list. Filters provide the PM, RM, and individual resource the ability to monitor work progress across multiple projects. For example: ~ PMs can filter for all assignments that were to be completed by a given date but still have "Started" or "Not Started" status. ~ If multiple projects are utilizing the same resource, the PM or RM can filter for assignments utilizing that specific resource to prevent over-utilization. ~ A resource may filter for all assignments assigned to them, providing a picture of their total body of work.
-
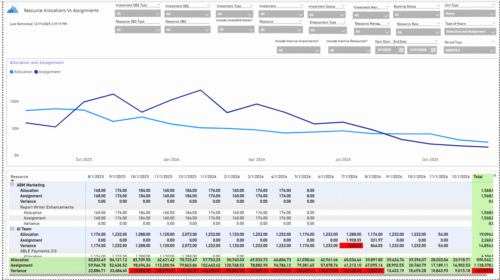 The Allocations and Assignments report displays resource assignments and allocations across multiple projects. This report will provide a single view of the assigned data for all assignments across multiple projects in-line with their allocations. The data is displayed by monthly periods. The horizontal and vertical sums provide a cumulative picture resource wise and month wise respectively. Filters provide the user the ability to monitor data across multiple projects. Filters include investment type, investment, resource, active/inactive resource or investment along with OBS type and OBS unit. If multiple projects are utilizing the same resource, the PM or RM can filter for assignments/allocations utilizing that specific resource to prevent over-allocations or under-allocations.
 -
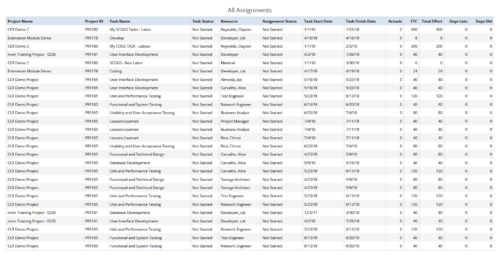 All Assignments report provides the Managers a single place to view all the assignments associated with a project(s). User can view only the investments that he has access to. This report also displays ETC, Actuals, Total Effort, Days Old (Elapsed days between Task Finish Date and Today's Date), Days Late (Elapsed days between Task Finish date and Task Baseline Finish date) associated with the task. You can further narrow your search by OBS Type & Path, Resource Name , Project Manager, Project Name, Project ID, Is project Active?, Assignment Start Date, Assignment Finish Date, Assignment Status and Task Status.
 -
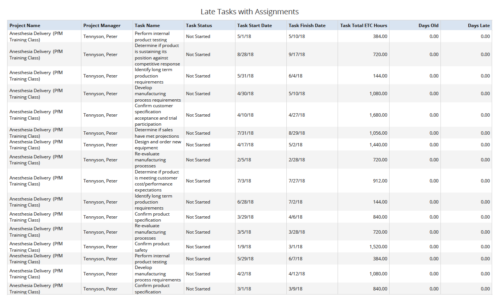 Late Tasks with Assignments report displays the list of all Tasks (with their Total ETC Hours) that are not closed but are past their finish date or past their baseline finish date. The report provides Project Manager the ability to view and track late tasks across multiple projects without going into each project individually. This report displays Project Name, Project Manager, Task Name, Task Status, Task Start Date, Task Finish Date, Days Old (Elapsed days between Task Finish Date and Today's Date), Days Late (Elapsed days between Task Finish date and Task Baseline Finish date). User can further narrow their search by Task Name, Task Status, Project ID, Project Name, Project Manager, Is Milestone?, Is late?, Task Start Date, Task Finish Date and Is Template?. User can use exact dates or relative dates for Task Start Date and Task Finish Date filter parameters.
 -
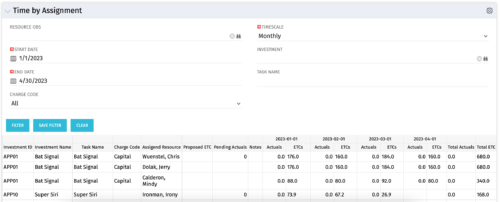 The Time by Assignment portlet displays time logged to assignments for all investments the logged in user has security rights to view - pulling data from the timeslices. It is capable of displaying the data by weekly, monthly or quarterly segments. The portlet may also be filtered by investment and resource OBS.
 -
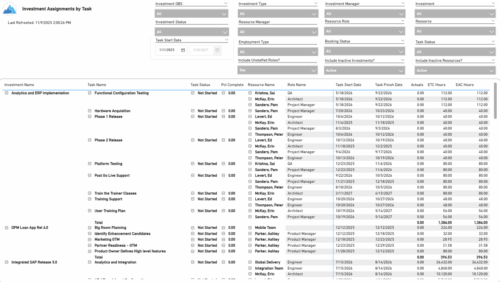 The Investment Assignments by Task report provides a detailed breakdown of effort at the task-assignment level for each investment. It displays both actuals and estimates for resource assignments, along with task status, percent complete, and assignment start and finish dates. Totals are available at the investment level, making it easy to analyze workload, progress, and effort distribution across tasks and resources.
 -
The Capacity Graph - Investment portlet displays Availability, Allocations, Assignments and Actuals for active resources in a single project. This portlet pulls from timeslices and allows the user to filter on weekly, monthly, or quarterly data. This portlet provides a Project Manager with a simple way to analyse: Allocations vs. Actuals and Allocations vs. ETC. Depending on metric goals, the graph allows the user to determine where areas of improvement may exist.
-
The Capacity Graph portlet displays Availability, Allocations, Actuals and Assignments for one or more active resource(s) in a single view. This portlet pulls data from timeslices, and allows the user to filter on a weekly, monthly or quarterly data. The Estimated Time to Complete (ETC) and Allocation data will only show for projects that are active. This portlet provides Resource Managers, PMOs and Executives with a simple way to analyse: Allocations vs. Availability, Allocations vs. Actuals, Allocations vs. ETC and ETC vs. Availability. The graph allows the user to determine where areas of improvement may exist and quickly identify potential areas of constraint. Note: the information displayed is dependent on what the user has security rights to view.
-
The All Assignments portlet displays resource assignments across multiple projects. Currently, assignment information displayed for the project, in OWB, or MSP is limited to a single project. This portlet will provide a single view of the assigned data for all assignments across multiple projects. The portlet displays project actuals and estimates from the project (datamart tables). The Days Late field is calculated by the baseline date, while the Days Old field is calculated by today's date. Note: Only the projects that the user has viewer rights to will show up in the list. Filters provide the PM, RM, and individual resource the ability to monitor work progress across multiple projects. For example: ~ PMs can filter for all assignments that were to be completed by a given date but still have "Started" or "Not Started" status. ~ If multiple projects are utilizing the same resource, the PM or RM can filter for assignments utilizing that specific resource to prevent over-utilization. ~ A resource may filter for all assignments assigned to them, providing a picture of their total body of work.
-
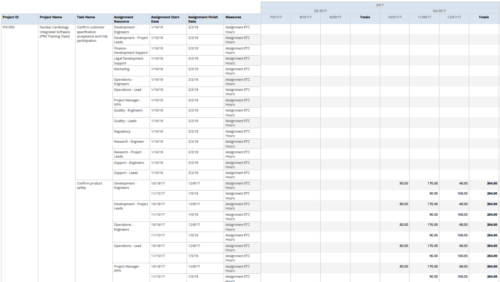 Assignments by Task Over Time report display all assignments by task for all resources. Information can be drilled down to yearly, quarterly or monthly level. This report helps in determining the tasks a user is assigned to or how many hours a user is assigned to a task. You can further narrow your search by OBS Type & Path, Project ID, Project Name, Task Name, Assignment Resource, Is project Active?, Is Template? And Month End date.
 -
The Time by Assignment portlet displays time logged to assignments for all investments the logged in user has security rights to view - pulling data from the timeslices. It is capable of displaying the data by weekly, monthly or quarterly segments. The portlet may also be filtered by investment and resource OBS.


Copyright 2023 • Rego Consulting Corporation • Privacy Policy