-
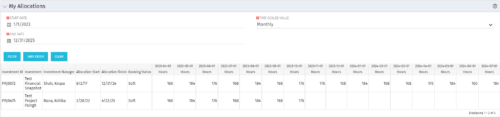 The My Allocations portlet will display the allocations for the logged in user - pulling data from the timeslices. It is used as a quick reference for the users to view their allocations across all of the projects where their allocation is greater than 0 for the specified date range the user wants. This will display both active and inactive projects.
 -
 The Capacity Graph - Investment portlet displays Availability, Allocations, Assignments and Actuals for active resources in a single project. This portlet pulls from timeslices and allows the user to filter on weekly, monthly, or quarterly data. This portlet provides a Project Manager with a simple way to analyse: Allocations vs. Actuals and Allocations vs. ETC. Depending on metric goals, the graph allows the user to determine where areas of improvement may exist.
 -
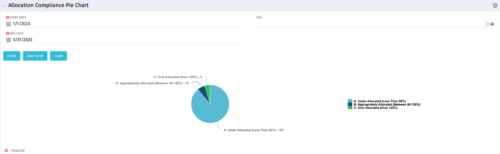
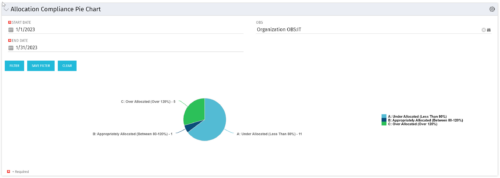 The Allocation Compliance Pie Chart portlet gives a view of active resources' allocation compliance within a date range and OBS displayed in a pie chart. It allows the user to the percentage of resources over, under, and adequately staffed on projects over a selected time period. This portlet leverages the daily allocation and daily availability slices as well as only active investments. The portlet provides filters for specific dates (required) and OBS.
 -
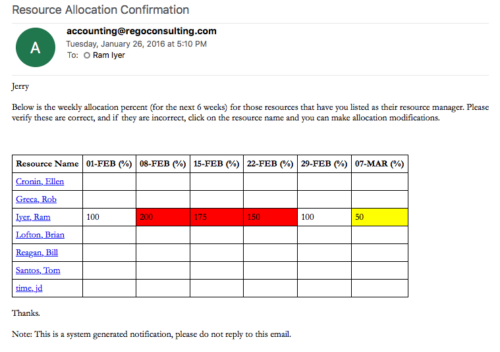 Process sends an email to RM, for resources assigned, that indicates the allocation percentage for each resource for the next 6 weeks. Email has links to each resource so that allocation modifications can be made as required.
 -
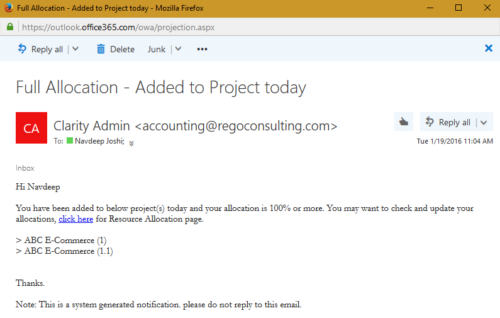 The process notifies resource who has been added to investment today and allocation is greater or equal to 100%. The process is on-demand and would require the user to have appropriate rights to run the process. Process should be scheduled as daily once job.
 -
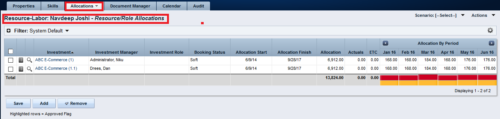
 This portlet displays the % allocation of resources to projects. The portlet shows if the resource is allocated to the projects as an individual resource or as part of an Agile team, in which case it will display the resource % allocation to the team and what that will represent in terms of % allocation to the project. The Total Allocation % display the allocation of the resource to all investments is allocated to. Remaining Capacity and Over/Under columns will help identify the resources that still have availability and the ones that are over allocated.
 -

This portlet displays the monthly allocation per resource. The PM can view by the RM or the resource to get the data for monthly resource allocations. The table below describes the available filter fields in the portlet. Column Label Description Work Effort Manager Manager of the Investment the Work Effort is on Work Effort Active Active status of the Investment the Work Effort is on Resource Resource’s Name Internal Resource ID Resource’s ID Zero Allocation Show Allocations that equal zero Open for Time Entry Is the Resource Open for Time Entry Resource Active Resource’s Active status Role Resource’s Primary Role OBS Unit Resource’s OBS Start Allocation Start Time to filter by End Allocation Finish time to filter by -
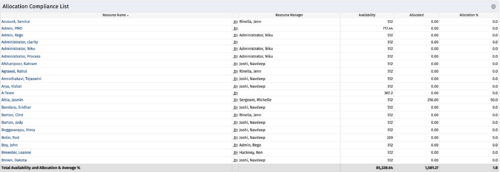
This Allocation Compliance Drilldown Enhancement portlet is used in conjunction with the Allocation Compliance Pie Chart. Once the user selects a specific section of the chart, the Allocation Compliance Drilldown Enhancement will display a list of resources fulfilling that selection. The Allocation Compliance list portlet shows the Resource Name, the Resource Manager, Availability, Allocated Hours and Allocation % for the selection. Note: The Allocation compliance pie chart is displayed first based on the filter selection i.e., Start Date, End Date and OBS. The pie chart is displayed as per the following three slices of the pie: Under Allocated (Less than 80%) Appropriately Allocated (Between 80-120%) Over Allocated (Above 120%) The slice of a pie can be clicked to display resource allocation compliance information in the Allocation Compliance List portlet, as described earlier. The table below describes the available columns in the Allocation Compliance list portlet. The first 5 are configured in the default view: Column Label Description Resource Name Name of the Resource Resource Manager Resource Manager Availability Resource Availability Allocated Resource Allocation Allocation % Resource Allocation % Res_id Unique identifier of the Resource -
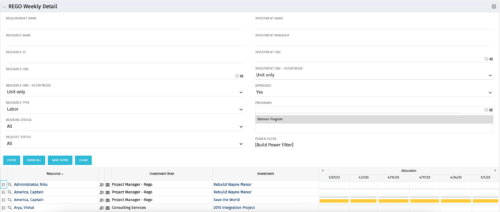 This is the same portlet as the out of the box Weekly Detail with an additional filter element for Program (multiple select). Portlet displays resource allocations graphically for each project in the specified program(s), for the next six weekly periods. Portlet filterable by numerous project, resource, and assignment attributes. Graphical representation shows Resource Availability Threshold and Allocation in hours, as a mouse-over.
 -
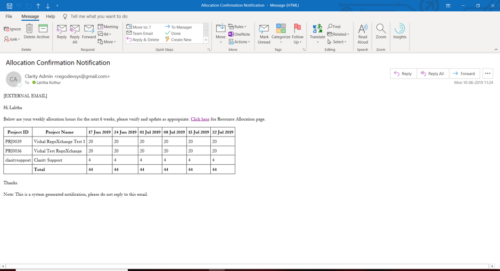 A Process run via Execute a Process job; sends an email to active resources, containing a facsimile of their Resource Allocation Detail page. It shows the next six weeks of allocations by investment, with a column total. The email also contains a click here link to this page in CA PPM, to enable editing of the data, as appropriate.
 -
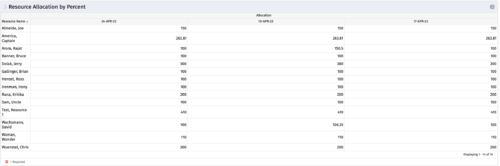 This portlet shows resource allocation by percent and hours, and gives ability to filter on allocation percent. The RM can use the portlet to see if any of the resources is over/ under allocated.
 -
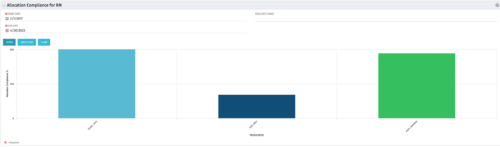 The Allocation Compliance by Resource (Resource Manager) portlet gives a view of resource allocation compliance for all active resources the logged in user is the Resource Manager for. It allows the RM to see resources they manage over the coming months and whether they are over or under allocated. This portlet leverages the daily allocation and daily availability slices as well as only active investments. The portlet provides filters for specific dates, filtering by resource ID, and resource name may also be added.


Copyright 2023 • Rego Consulting Corporation • Privacy Policy