
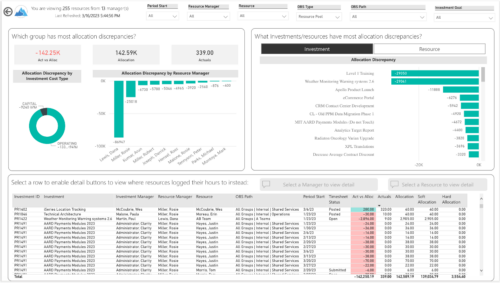
- Allocation Discrepancies
- Resource Detail
- Resource Skills
- Resource Summary
- Resource Tasks
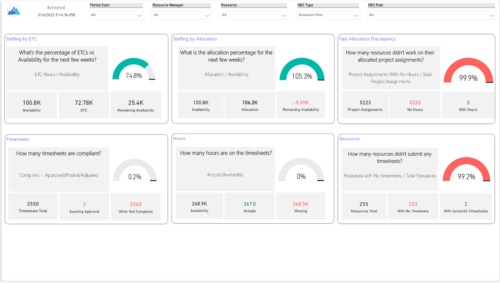
- Staffing Allocations
- Staffing ETC
-
 Evaluate resource allocations, identify bottlenecks, and ensure optimal resource utilization across projects and teams. Report Views include:
 -
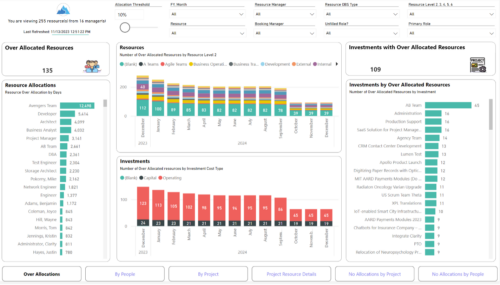
 Evaluate resource allocations, identify bottlenecks, and ensure optimal resource utilization across projects and teams. Report Views include: • Over Allocation • By Project • By People • Project Resource Details • No Allocations by Project • No Allocations by People The main .rpt file will access data through the Data Warehouse.
 -
 Actuals & ETC by Resource Assignment report provides project managers a single place to view Actuals and ETC associated with resources across multiple Tasks and Projects. It displays the following: Actual and ETC Hours by Start Date: Stacked Column chart that displays the total Actual hours and ETC hours per month of fiscal period. Grey color indicates Actuals and Purple indicates ETC hours during that month. Grid: Displays Investment name, Task, Assigned resource ETC and Actual hours per month of fiscal period. It also displays aggregated column and row totals for Actuals and ETC hours. You can further narrow your search by OBS Type, OBS Path & Start Date range.
 -
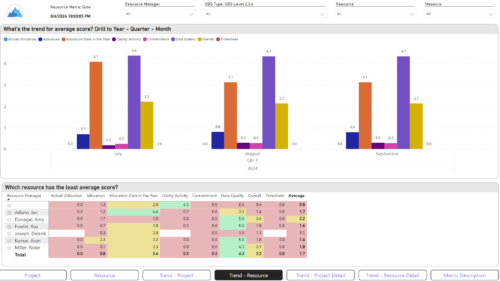
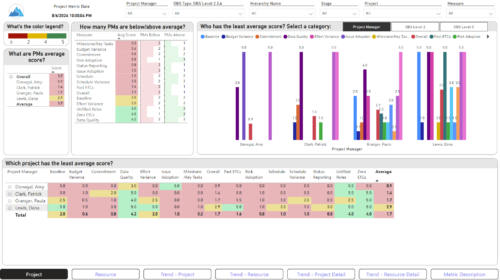 The Adoption Dashboard is designed to enhance data integrity and project tracking within Clarity by providing insights into how well users are populating and managing their project and resource data. Features: · Project Data Quality Evaluate the accuracy of project status reporting, risk, issue tracking, and schedule adherence. · Resource Data Quality Assess how well resource managers are managing timesheets, allocations, and actual utilization. · Adoption Scoring View Rate the consistency of data entry across projects and resources on a scale of 0-5, helping identify areas needing improvement. · Variance Analysis View Track discrepancies in project schedules, effort, budgets, and resource commitments. · Compliance Monitoring Ensure that all necessary project and resource data is up-to-date, aiding in more informed decision-making and better project outcomes.
 -
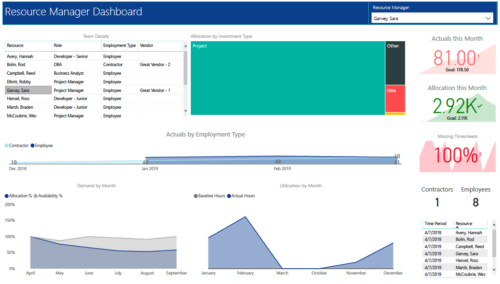 RM Dashboard shows various KPIs like Actuals posted by the resources in last month, Allocation in current month, count of missed timesheets etc. Team Details – Grid report providing list of all the resources managed by a resource manager. Allocation by Investment type – Tree graph displaying distribution pattern of allocation hours across different investment types. Actuals by Employment Type - Area graph, displaying actual hours posted by Employees Vs Contractors. Demand by Month – Area graph, displaying Allocation Vs Availability for next 6 months. Utilization by Month - Area graph, displaying Baseline Vs Actuals hours over last 6 months.
 -
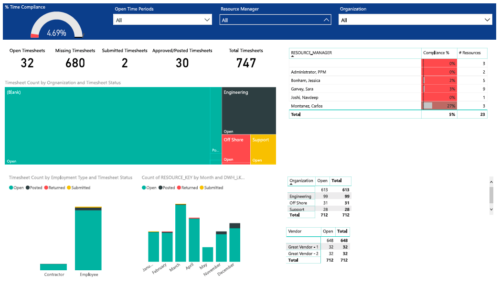 Timesheet compliance is a dashboard containing multiple visualizations that shows timesheet compliance data under various scenarios. Dashboard shows count of timesheets grouped by Status and total available timesheets. % Time Compliance – Gauge graph that shows percentage of completed timesheets against overall timesheets. Compliance by Resource Manager – Grid section that shows percent timesheet compliance by resource manager. Timesheet count by Employment type and Timesheet Status – Stacked column chart, each column represents Employment type and sections of the column represent count of timesheets by Status. Count of Timesheets by Months – Stacked column chart, each column represents a month and sections of the column represent count of timesheets by Status. Dashboard also const of two grid sections displaying number of Open timesheets by Organization and Vendor.
 -
 Evaluate resource allocations, identify bottlenecks, and ensure optimal resource utilization across projects and teams. Report Views include: • Over Allocation • By Project • By People • Project Resource Details • No Allocations by Project • No Allocations by People The main file will access data through custom queries created via Rego Odata connector.
 -
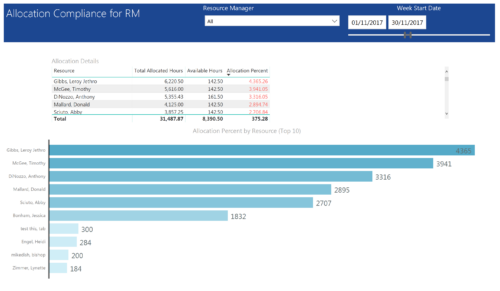 Allocation Compliance by RM report provides resource managers a single place to view Available hours, Allocation Hours and Allocation Percentage of Resources. It considers the resources of selected resource manager and it displays the following: Allocation Details Grid: Displays Resource and its Allocated hours, Available hours and Allocation percentage (Allocated hours/Available Hours) Allocation Percent by Resource: Bar chart that displays Allocation Percentage (top 10) for various resources during the selected Time frame. You can further narrow your search by Resource Manager & Month Start Date range.
 -
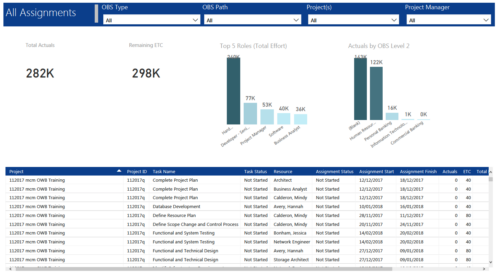 All Assignments report provides project managers a single place to view KPIs related to Task Assignments. All the KPIs are depicted in various visualizations. Total Actuals: Scorecard that displays the sum of actuals associated with assignments for the selected criteria. Remaining ETC: Scorecard that displays the sum of current ETC associated with assignments for the selected criteria. Top 5 Roles (Total Effort): Column chart that displays Effort (Actuals + ETC) by Roles. X axis displays various Roles. Data labels indicate sum of effort associated with that Role. Actuals by OBS level 2: Column chart that displays Actuals by OBS level 2. X axis displays various OBS level 2. Data labels indicate sum of actuals associated with that OBS. Grid: Displays Assignment details such as Project ID, Project Name, Task Name, Task Status, Assigned Resource, Assignment Status, Assignment Start, Assignment Finish, Actuals, ETC, Total Effort, Days Late and Days Old. You can further narrow your search by OBS Type, OBS Path, Project(s) and Project Manager.
 -
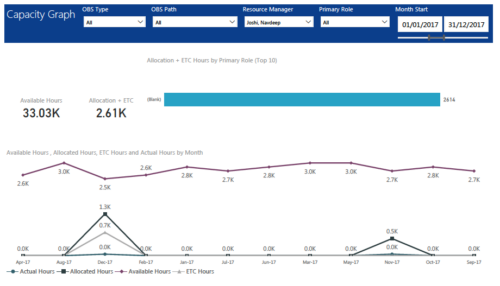 Capacity Graph report displays Availability, Allocations, Actuals and Assignments for one or more active resource(s) in a single view. Report contains the following components: KPIs: Displays Available hours, Allocation + ETC for filtered criteria. Bar graph: Displays Allocation + ETC by primary role Line chart: Displays Availability, Allocations, Actuals and Assignments by time period. This portlet provides Resource Managers, PMOs and Executives with a simple way to analyze: Allocations vs. Availability, Allocations vs. Actuals, Allocations vs. ETC and ETC vs. Availability. User can further narrow their search by OBS Type & Path, Resource Manager, Primary Role, Start and End Date.
 -
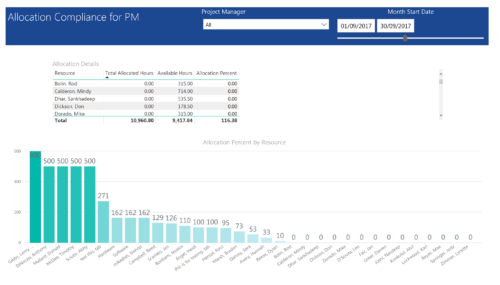 Allocation Compliance by PM report provides project managers a single place to view Available hours, Allocation Hours and Allocation Percentage of Investment Team Resources. It considers the investments of selected project manager and it displays the following: Allocation Details Grid: Displays Resource and its Allocated hours, Available hours and Allocation percentage (Allocated hours/Available Hours) Allocation Percent by Resource: Column chart that displays Allocation Percentage for various resources during the selected Time frame. You can further narrow your search by Project Manager & Month Start Date range.
 -
 This session will aligning you with some of the best and most common practices for using Clarity's Resource Management capabilities. Come and learn about the cababilities that come out of the box for resource insights like allocations, assignments, availability and more. Additionally, tips and tricks will be discussed leaving you with a toolkit of ideas for your organization!
