RegoXchange
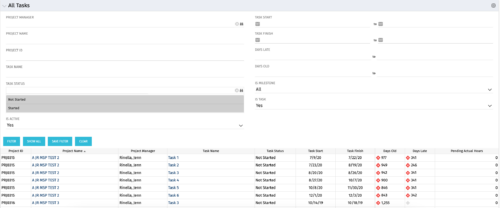
  • The All Tasks portlet displays all tasks related to active projects that the logged in user has view rights to.  The portlet provides the project manager a single place to view tasks across multiple projects without having to go into each project individually, and allows for more efficient management and reporting across projects. The portlet displays project actuals and estimates from the project (datamart tables). The portlet allows analysis like:
    • PMs may have several critical tasks that were supposed to start on a certain date.  To verify progress, they filter for that start date to perform a review of the tasks.
    • PMs can review days late to see how tasks are doing against the baseline date (<7 days is green, 7-14 is yellow, and >14 is red)
    • PMs can review days old to see how tasks are doing against today’s date (<7 days is green, 7-14 is yellow, and >14 is red)
    The table below describes the available columns in the portlet. The first 10 are configured in the default view:
    Column Label Description
    Project ID Unique project identifier
    Project Name Name of the project
    Project Manager Manager of the project
    Task Name Name of the task
    Task Status Not Started, Started, or Completed
    Task Start Start Date of this task
    Task Finish Finish Date of this task
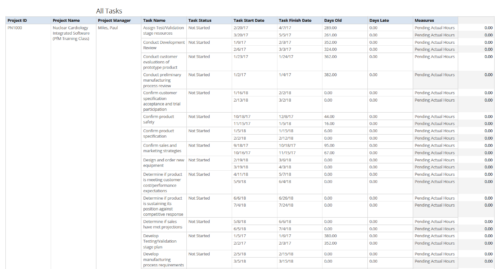
  • All Tasks report provides the Project Managers a single place to view all the tasks associated with a project(s). User can view only the investments that he has access. Project Managers can use this report to view the progress of the tasks and check how the tasks are performing against baseline date. User can further narrow their search by OBS Type & Path, Investment Name, Month Start Date and Is Project Active?.
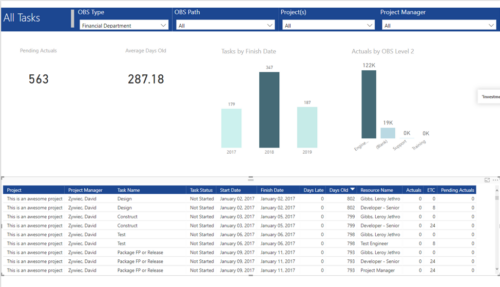
  • All Tasks report provides project managers a single place to view KPIs related to Tasks.  All the KPIs are depicted in various visualizations. Pending Actuals:  Scorecard that displays the # of Actuals that are still open and not yet posted. Average Days Old:  Scorecard that displays the average number of Task Days Old. Days Old is the difference between Task Finish date and Today’s Date (when Today’s Date > Task Finish date. In other cases, it is zero) Tasks by Finish Date: Column chart that displays # of Tasks by Year of Finish date. X axis display Calendar years. Data labels indicate the number of Tasks finish date within that year. Actuals by OBS level 2: Column chart that displays sum of Task Actuals by OBS level 2. X axis display OBS level2. Data labels indicate the Actuals within that OBS level2. Grid: Displays Risk details such as Project Name, Project Manager, Task Name, Task Status, Start Date, Finish Date, Days Late, Days Old, Actuals, ETC and Pending Actuals Days Late is the difference between Task Finish date and Baseline Finish Date (when Baseline Finish Date > Task Finish date. In other cases, it is zero) You can further narrow your search by OBS Type, OBS Path, Project(s) and Project Manager.
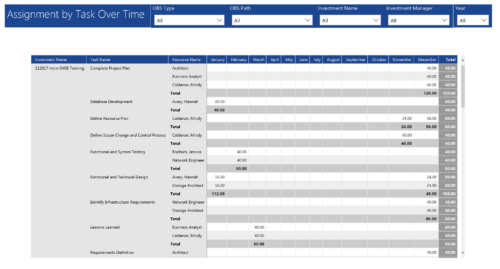
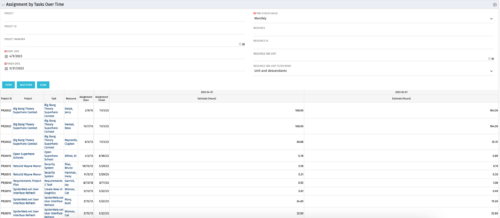
  • Assignments by Task Over Time report display all assignments by task for all resources. Information is displayed on monthly basis. This report displays Investment Name, Task Name, Resource Name and its monthly assignments. You can further narrow your search by OBS Type & Path, Investment Manager, Investment Name, and Year
  • The Assignments by Task Over Time portlet displays all assignments by task for all resources using the timeslices. This portlet is useful for determining which tasks a user is assigned to or how many hours the user is assigned to a task. The user may filter on certain criteria that include: project name/ID, date range, resource name/ID, and resource OBS unit.
  • The Assignments by Task Over Time portlet displays all assignments by task for all resources using the timeslices. This portlet is useful for determining which tasks a user is assigned to or how many hours the user is assigned to a task. The user may filter on certain criteria that include: project name/ID, date range, resource name/ID, and resource OBS unit.
  • The Assignments by Task Over Time portlet displays all assignments by task for all resources using the timeslices. This portlet is useful for determining which tasks a user is assigned to or how many hours the user is assigned to a task. The user may filter on certain criteria that include: project name/ID, date range, resource name/ID, and resource OBS unit.
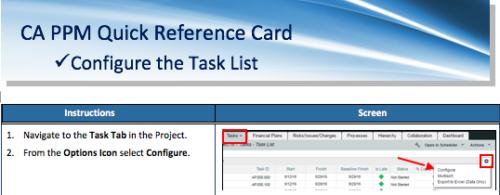
  • A Quick Reference Card to assist as you configure the Task List under the Task Tab on the project.  You have the option to remove or add fields to the Task List.
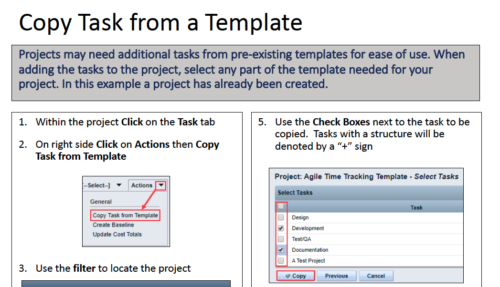
  • Projects may need additional tasks from pre-existing templates for ease of use. When adding the tasks to the project, select any part of the template needed for your project. In this Quick Reference Guide, a project has already been created.
  • A Quick Reference Guide to assist in the creation of Tasks using the Clarity Gantt.  The screen shots utilize the Classic UX with the Phoenix theme.
Go to Top