-
 Agile metrics can be very different from traditional waterfall metrics. This session will walk through some of the key Agile metrics describing how and why they are used. Effective methods in reporting and sharing will also be covered.
 -
 Would you like to get an overview of the fundamentals of Agile? This session will dispel the misconceptions of Agile and provide an understanding and definition of terms such as “bi-modal”, “Scrum”, “Kanban”, “weighted shortest job first” and “SAFe”. We will also talk about how Clarity fits into the Agile discussion and provide thoughts and practices on how PMOs are responding to this trending methodology.
 -
 Have you considered using Rally in conjunction with Clarity? Have you seen or heard about the OOTB connector? This class will go through the OOTB connector in detail and show how Rego has built our ad-on to enhance the connectivity between these two tools.
 -
 It is quite common for Rally and Jira to coexist. However, connecting them effectively enhances the value stream for development teams and product owners. Learn what is available to make this happen along with some typical design patterns.
 -
 PMOs/EPMOs are feeling some pressure from Agile disruptors in their organizations. Some Agile purists insist that they can do everything with an Agile tool and no PMO governance, but this really isn’t the case. If you belong to a PMO or EPMO, this session will help you to better collaborate with your Agile counterparts in finding better and more holistic solutions to value delivery. Tips on how to use Agile principles in your talking points will also be shared.
 -
 Rally Software introduction including high level feature and functionality for Agile and portfolio planning and tracking, analytics and reporting, and overall benefits of Rally in the marketplace along with a product demo.
 -
 The Time By Type - Pie Chart portlet is a graphical representation of time by type of investment for all resources the logged in user has security rights to view. This portlet pulls from the daily timeslices, and can be used for determining what types of projects receive the majority of hours. The filter option allows for entry of a specific start date and finish date.
 -
The Time By Type - Pie Chart portlet is a graphical representation of time by type of investment for all resources the logged in user has security rights to view. This portlet pulls from the daily timeslices, and can be used for determining what types of projects receive the majority of hours. The filter option allows for entry of a specific start date and finish date.
-
 The Dashboard: Project Status Single-line portlet gives an overview of the project overall status as well as the status indicators on the "current" status report object. The portlet will pull the "id" from the page it is placed on, so this portlet is usually placed on the project dashboard tab. This portlet displays the report date, symbols relating to the overall status, scope, schedule, cost/effort, and the overall explanation across a single line in the portlet.
 -
 The Dashboard: Project Information portlet gives a set of high-level information about the project. The portlet will pull the "id" from the page it is placed on, so this portlet is usually placed on the project dashboard tab. The portlet displays the name, project ID, project manager, description, start date, finish date, baseline start, and baseline finish.
 -
The Dashboard: Project Information portlet gives a set of high-level information about the project. The portlet will pull the "id" from the page it is placed on, so this portlet is usually placed on the project dashboard tab. The portlet displays the name, project ID, project manager, description, start date, finish date, baseline start, and baseline finish.
-
The Dashboard: Project Status Single-line portlet gives an overview of the project overall status as well as the status indicators on the "current" status report object. The portlet will pull the "id" from the page it is placed on, so this portlet is usually placed on the project dashboard tab. This portlet displays the report date, symbols relating to the overall status, scope, schedule, cost/effort, and the overall explanation across a single line in the portlet.
-
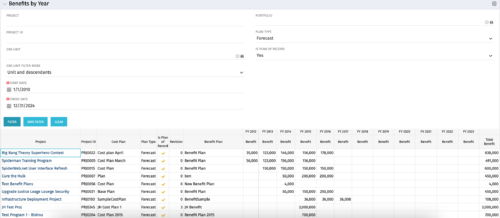 The Benefits by Year portlet summarizes Benefit totals by year and is searchable by Project, OBS and Portfolio. The results display both Budgeted Benefit Plans and Forecast Plans and the associated Cost Plan. Users can make use of this portlet to view Benefit Plan totals across an OBS or Portfolio or to compare the Budgeted Benefit of a Project versus the current plan.
 -
The Benefits by Year portlet summarizes Benefit totals by year and is searchable by Project, OBS and Portfolio. The results display both Budgeted Benefit Plans and Forecast Plans and the associated Cost Plan. Users can make use of this portlet to view Benefit Plan totals across an OBS or Portfolio or to compare the Budgeted Benefit of a Project versus the current plan.
-
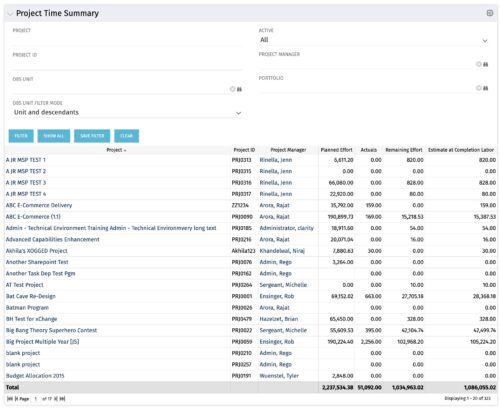 Project managers may use this portlet to show the planned effort and the remaining effort on projects. Includes actual hours as well as estimate at completion. You may narrow the results by filtering by project name, project manager, project OBS, or active flag. The portlet will display each project by ID, name, project manager, planned effort (total allocation hours), actual hours, remaining effort (ETC), and estimate at complete (actual + ETC).
 -
Project managers may use this portlet to show the planned effort and the remaining effort on projects. Includes actual hours as well as estimate at completion. You may narrow the results by filtering by project name, project manager, project OBS, or active flag. The portlet will display each project by ID, name, project manager, planned effort (total allocation hours), actual hours, remaining effort (ETC), and estimate at complete (actual + ETC).
-
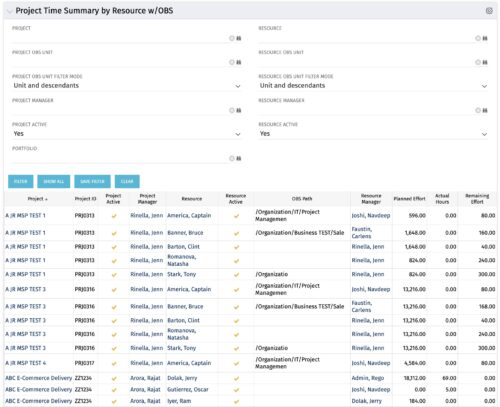 The purpose is to show actual hours, planned effort and remaining effort at the resource level, with the addition of OBS levels to support filtering and manipulation of the exported data.
 -
The purpose is to show actual hours, planned effort and remaining effort at the resource level, with the addition of OBS levels to support filtering and manipulation of the exported data.
-
The purpose is to show actual hours, planned effort and remaining effort at the resource level, with the addition of OBS levels to support filtering and manipulation of the exported data.


Copyright 2023 • Rego Consulting Corporation • Privacy Policy