-
 Rally Software introduction including high level feature and functionality for Agile and portfolio planning and tracking, analytics and reporting, and overall benefits of Rally in the marketplace along with a product demo.
 -
 It is quite common for Rally and Jira to coexist. However, connecting them effectively enhances the value stream for development teams and product owners. Learn what is available to make this happen along with some typical design patterns.
 -
 Learn about the various techniques and emerging methods companies are taking to capitalize Agile work. You'll learn how some companies are moving away from timesheets and using models based on story points and team rates to generate capitalization reporting.
 -
 This training document is a Rego Consulting Quick Reference Guide to assist with the utilization of Tasks and To Do’s in Clarity’s Modern User Experience. This doc references version 16.1 views. Document references the Tasks and To Do’s menu items and their associated widgets.
 -
 A presentation slide deck from Rego University 2022. The course discusses factors that differentiate Requirements.
- Introduction (What & Why)
- Definition & Uses of Requirements
- The Challenges in Requirements in Software
- Revisit the Agile Taxonomy
- The Transition from Traditional to Agile
- Rethink the Agile Portfolio
- Guidelines and Characteristic of Taxonomy
-
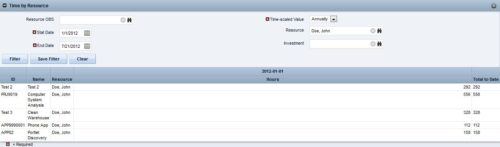
 This portlet displays the actual hours resources entered against investments. The per-period actual hours can be showed in days, weeks, months, quarters, or years. The data can be filtered by Resource, Resource Manager, OBS Unit, Investment and time period
 -
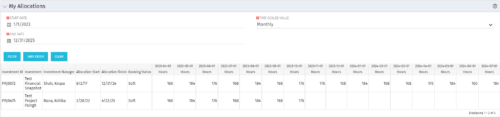 The My Allocations portlet will display the allocations for the logged in user - pulling data from the timeslices. It is used as a quick reference for the users to view their allocations across all of the projects where their allocation is greater than 0 for the specified date range the user wants. This will display both active and inactive projects.
 -
 The All Status Reports portlet displays any published Status Report related to a project or across multiple projects. The filter then allows the user to narrow their search by Project Manager, Project, Status or Overall Status Category (overall, cost & effort, scope or schedule). The user may also select if they wish to view only current Status Reports, or to include historical reports as well. The portlet provides the project manager a single place to view all of the status reports without having to go into each project individually, and allows for more efficient management and reporting across projects. Note: Only the projects that the user has view rights to will show up in the list.
 -
 The All Issues portlet displays all Issues related to active projects that the logged in user has view rights to. The portlet provides the project manager a single place to view issues across multiple projects without having to go into each project individually, and allows for more efficient management and reporting across projects. The filter then allows the user to narrow their search by Issue ID, Issue Name, Project ID, Project Name, the individual to whom the issue is assigned, and Issue Status. You may also narrow the view to display issues with a target resolution date within a certain date range, or Issues associated with a particular Category or OBS unit. Note: Only the projects that the user has viewer rights to will show up in the list.
 -
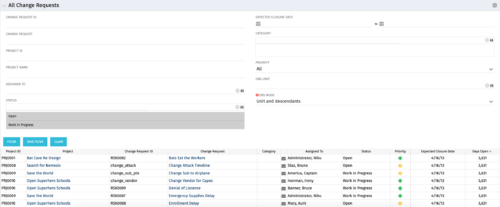 The All Change Request portlet displays all change requests related to active projects that the logged in user has view rights to. The portlet provides the project manager a single place to view change requests across multiple projects without having to go into each project individually and allows for more efficient management and reporting across projects. The filter allows the user to narrow their search by date ranges, resources involved, and/or the project with which the Change Request is associated. Other alternatives for filtering include the category, priority or status of the Change Request. In the list view, a status is displayed for each Change Request (CR), along with the Project with which the CR is associated, the CR ID, the CR name, the resource to whom the CR is assigned, Priority, Expected Closure Date, and number of days the CR has remained open. Note: Only the projects that the user has viewer rights to will show up in the list.
 -
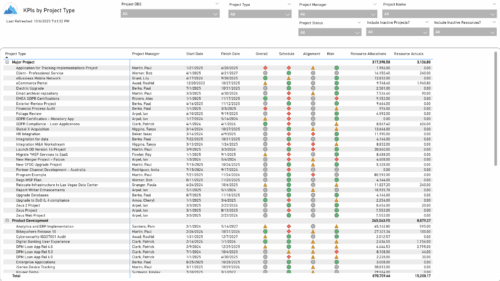 The KPIs by Project Type report provides a consolidated view of key performance indicators across projects, grouped by project type. It highlights metrics such as overall status, schedule, alignment, and risk, along with resource allocation and actual hours tracked since each project’s inception. This report enables quick comparison of performance trends and resource utilization across different project types.
 -
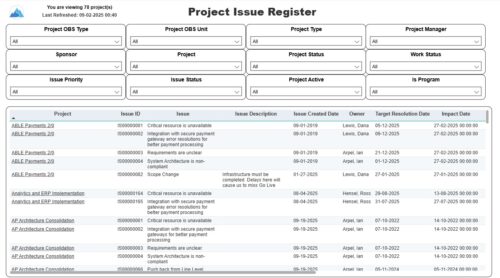 The Project Issue Register report displays comprehensive information for each project issue. The issue register also provides the option to display items that are associated to the issue such as notes, action items, and tasks. Report Prerequisites Verify that you have completed the following prerequisites before you run this report: • The project must have at least one issue for the project to display in the report. • The issue properties must have fields such as description, category, resolution, target resolution, impact date, and originating ID completed for them to display data in the report. The issue name, issue ID, priority, status, and owner are required in Classic PPM so they always display data.
 -
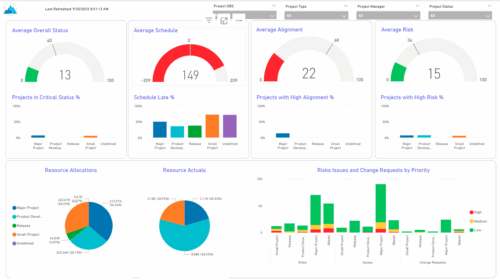 The KPIs by Project Type (Dashboard) report provides visibility into key project health measures, including status, schedule, alignment, and risk. Gauge visuals highlight each KPI at a summary level, while column charts break down results by project type. Resource allocation and actual hours are summarized in pie charts, making it easy to compare utilization across project types. In addition, bar charts display the number of issues, risks, and change requests by project type and priority, helping teams quickly identify areas of concern.
 -
 Want to boost Clarity adoption and data quality, all while having fun and keeping users engaged? Learn how gamification can benefit your organization in this exclusive demo. Check out features that reward users for desired behaviors, enable personalization, and offer fun ways to track project health through the animated world of Planimals.
 -
 The need to report and organize work around the Products continues to grow. Join this session to hear how Project and Product Management can thrive together in Clarity.
 -
 This session will align you with best practices for using Clarity's project management functionality. Come and learn about the OOTB capabilities for excellent project management, including: scheduling, assignments, staffing, views, financial plans, and other general project management capabilities. Additionally, tips and tricks will be shared, providing you with a toolkit of ideas for your organization!
 -
 The Project Risk Register report provides visibility into project risks, including detailed information on each risk and its associated items such as notes, action items, tasks, and related risks or issues. Results can be grouped by project or viewed without grouping to support flexible analysis. Interactive visuals make it easy to track, monitor, and manage risks across projects.
 -
 This training document is a Rego Consulting Quick Reference Guide to assist with Idea approval and conversion to projects in Clarity’s Modern User Experience. This doc references version 16.2.1 views. Doc reviews setting Ideas as Approved and converting Ideas to projects.
 -
 Without good data, your digital transformation won’t succeed. This session talks about generating and understanding value stream metrics, including how investments and teams are performing.
 -
 With only 15% of companies successfully transforming digitally, it’s time for the PMO to take charge. This session talks about how the PMO effectively can support the digital transformation within the enterprise by reimagine its traditional charter
 -
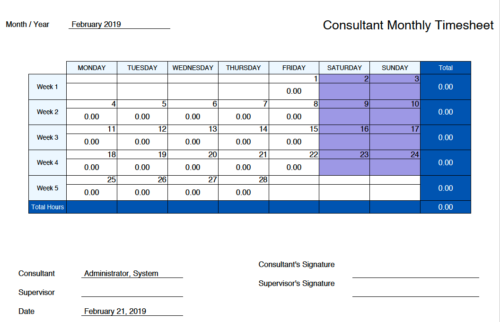 Monthly Actuals -User View is a standard calendar view of actuals posted by logged in user on each day of the selected month. Actuals also includes timesheets that haven’t been submitted/posted yet. Actual hours on the report are tied to user's availability i.e. when user has 0 availability (Saturday/Sunday/Holiday) then actuals are greyed out.
 -
 This portlet shows the project costs by Month. The information displayed includes:
- Start Date for project
- End Date for project
- Budgeted Cost
- Planned Cost
- Actual Hours
-
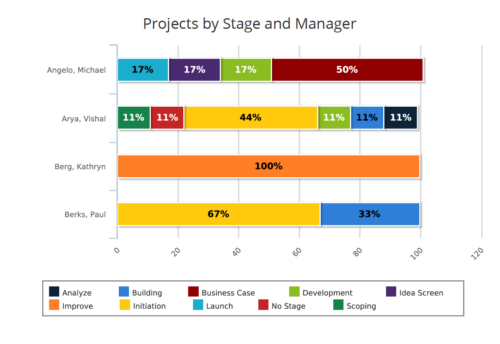 Projects by Stage and Manager report is a stacked bar chart that displays percentage of projects associated with project manager at a particular stage. Legend displays colors used to represent various Project Stages. This report provides to PMO a quick snapshot of where certain projects are sitting with each Project Manager. You can further narrow your search by Project Manager, Project Name, Is Project Active? , Is Template? And Is Program?
 -
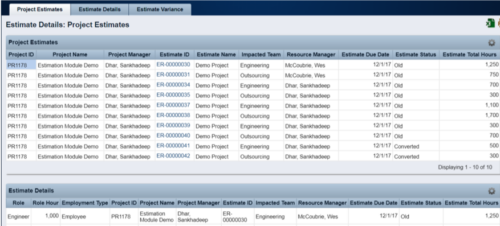 The Rego Estimation Module Provides a more accurate estimate earlier in the idea/project lifecycle.
- Is applied consistently so it can be improved.
- Retains the data in Clarity to enable analysis.
- Provides ongoing feedback by comparing estimates to current EAC.
- Provides historical record of estimating for projects overall as well as change requests.
-
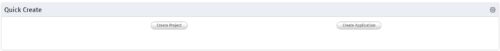 An HTML portlet that displays two buttons that link the user instantly to an object create page. The portlet comes with two buttons and the buttons can be modified to link to any creation page. Administrator can choose: Project, Idea, Application, Program, etc.
 -
 This training document is a Rego Consulting Quick Reference Guide to assist with utilization of the Staffing page in Clarity’s Modern User Experience. This doc references version 16.0.3 views. Document provides detail on the layout and capabilities of the Staff Grid as well as the Allocations Timeline. Information is provided on columns, widgets and filtering. Instructions are provided on how to save Views. Summary information is provided on the layout of the Allocation Timeline and includes detail on the Investment Timeline and the Resource Histogram. Investment Timeline summary contains information on the Allocations by Investments and the Allocations by Resources tabs. While the Resource Histogram section provides screenshots on Resource Availability and Resources by Role.
 -
 This training document is a Rego Consulting Quick Reference Guide to assist with the adding of resources to the Staff tab for Ideas in Clarity’s Modern User Experience. This doc references version 16.0.3 views. Document provides detail on how to add resources to the Staff tab, Default Allocation % and Per-Period metrics.
 -
 This training document is a Rego Consulting Quick Reference Guide to assist with Task Assignments in Clarity’s Modern User Experience. This doc references version 16.0.2 views. Document provides detail on how to use the Assignments tab to add resources to tasks, tips on how to group resource data, updating ETC values and Per-Period Metrics.
 -
 This training document is a Rego Consulting Quick Reference Guide to assist with the management of project tasks from within the Tasks tab in Clarity’s Modern User Experience. This doc references version 16.0.2 views. Document covers Task Tab, Timeline View, Board View, Grid View, adding and removing columns, saving views, task details, To Dos, Assignments, Links, Conversations and View Options settings.
 -
 This training document is a Rego Consulting Quick Reference Guide to assist with utilization of the Staffing page in Clarity’s Modern User Experience. This doc references version 16.0.2 views. Document provides detail on the layout and capabilities of the Staff Grid as well as the Allocations Timeline. Information is provided on columns, widgets and filtering. Instructions are provided on how to save Views. Summary information is provided on the layout of the Allocation Timeline and includes detail on the Investment Timeline and the Resource Histogram. Investment Timeline summary contains information on the Allocations by Investments and the Allocations by Resources tabs. While the Resource Histogram section provides screenshots on Resource Availability and Resources by Role.
 -


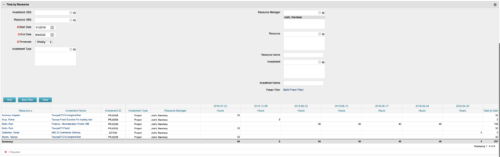
The Percent Time by Type and Timescale - Grid portlet shows a breakout of time by timescale for resources the logged in user has view rights for using the timeslices. This portlet gives the Clarity user the ability to show the amount of hours spent on a project by week, month, quarter and year. Using this portlet, the Clarity user can get an overview of all hours in a time period or use the filter to search for a specific dataset (as required). The portlet provides a filter for OBS and date ranges. -
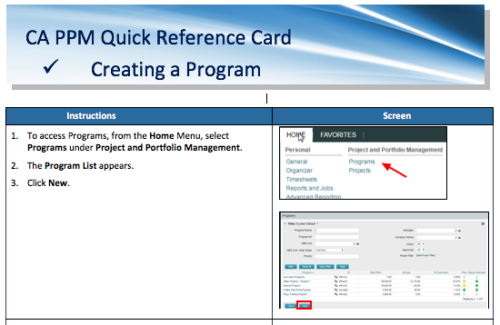 A Quick Reference Card to assist in the creation of a Program.
 -
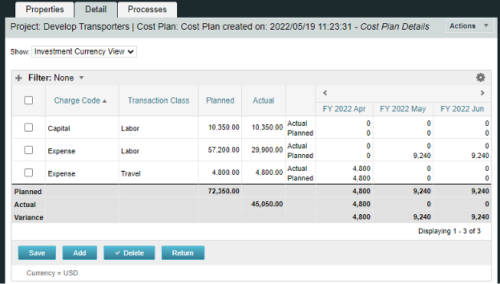
A process creating a new Cost Plan. Cost Plan properties:
Pre-conditions:Name Cost Plan created on: yyyy/mm/dd hh:mm:ss Grouping attributes Charge Code, Transaction Type Start Period The earliest fiscal period with Actuals (from PPA_WIP table) or current period, if there are no actuals Finish Period The latest fiscal period with a non-zero allocation (from PRJ_BLB_SLICES table, SLICE_REQUEST_ID = 6 Period Type Monthly Plan of Record True Planned Cost For periods in the past – from Actuals (Charge Code, Transaction Type, Quantity (Units), Cost (Amount) taken from Transactions (PPA_WIP & PPA_WIP_DETAILS); For current and future periods – from Allocations (Charge Code taken from the Project, Transaction Class from the Resource, Quantity from allocation slices, Cost from the Rate Matrix (NBI_PROJ_RES_RATES_AND_COSTS table) - the Project must be financially enabled.
- if a new Team Member is added, Rate Matrix job must be run, so the rates are populated in the NBI table.
- if the Allocation changes, allow the timeslice job to finish before running the process.
- the Project should have the Charge Code set.
-
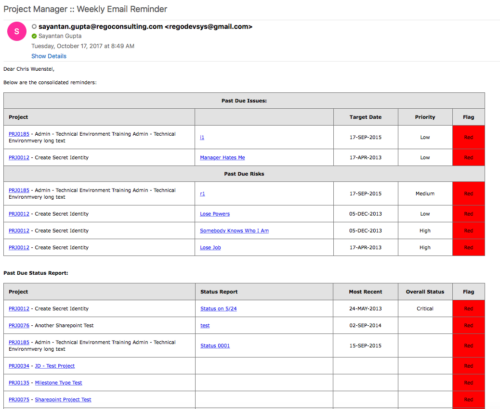 A process that:
- is a weekly email to a project manager. All of the content will be for where the person getting the email is the PM
- shows aggregate data for all of their projects
- sends the PM a reminder email at the end of each week showing the items that the PM needs to do. Maybe call it Weekly PM reminder.
- Shows the mentioned data in sections as follows:
- Past Due issues
- Only active projects
- Only open issues – not resolved or closed
- Show project name, project ID, issue name, issue priority, target resolution date, color (only red or yellow)
- Logic for Yellow = where target resolution is within the next week
- Logic for Red = target resolution date is in the past
- URL LINK: to that issue
- Past Due Risks
- Only active projects
- Only open risks – not resolved or closed
- Show project name, project ID, risk name, risk priority, target resolution date, color (only red or yellow)
- Logic for Yellow = where target resolution is within the next week
- Logic for Red = target resolution date is in the past
- URL LINK: to that risk
- Past Due Status Report
- Only active projects
- Show project name, project ID, report date, most recent overall status, color (only red or yellow)
- Only 1 line per project – show even if there is no status report
- Logic for Yellow = where latest status report date > 7 days ago
- Logic for Red = latest status report date is > 14 days ago
- URL LINK: to status report list
- Past Due Milestones
- Only active projects
- Only open milestones
- Show project name, project ID, task name, task finish date, color (only red or yellow)
- Logic for Yellow = where finish is within the next week
- Logic for Red = finish date is in the past
- URL LINK: to that milestone
- Past Due Forecast
- Only active projects
- Show project name, project ID, last updated date, most recent total plan of record amount, color (only red or yellow)
- Only 1 line per project – show even if there is no finish plan
- Logic for Yellow = where last updated date of the plan of record > 14 days ago
- Logic for Red = where last updated date of the plan of record > 30 days ago
- URL LINK: to cost plan
- Allocation Summary for the Project Team
- Past Due issues
- Unfilled Roles that need to be staffed
- Resources Actuals +/- 25% of Allocation
- Resource ETC +/- 25% of Allocation
- Pending Change Controls / Approval Status
- In addition to the Past Due Milestones, upcoming milestones
- Budget Summary
- Actual vs. Planned
- Burndown estimate
-
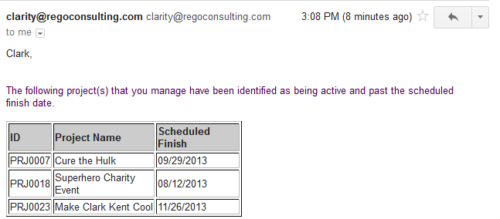 Based on the pre-determined schedule frequency, this job will send an email to Project Managers that have a project meeting the criteria of: project(s) are active and scheduled finish date is less than the current date. This serves as a reminder to Project Managers to keep their schedules true. The contents of the email include a message indicating the project manager has at least one project meeting this criteria and a table indicating the Project ID, Project Name and Scheduled Finish Date.
 -
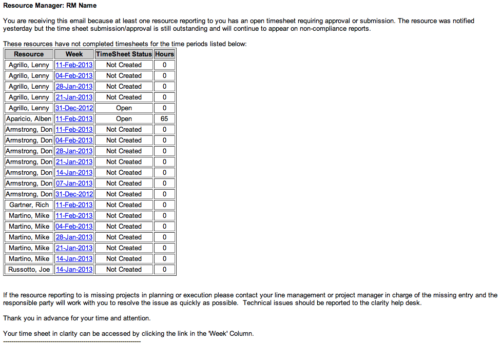 The Time Tracking Stalker - RM workflow process automatically sends an email to Resource Managers for each one of their resources that have not submitted their timesheet for a prior open time period, thus informing the RM if their resources are submitting their timesheets on time. Project Managers will also benefit since the notifications will help to ensure that time is being posted against their projects in a timely manner, helping to provide them with an accurate view of time expended on the projects.


Copyright 2023 • Rego Consulting Corporation • Privacy Policy