-
 Imagine responding to Clarity PPM workflow tasks (like timesheet approvals, budget reviews, and stage gate decisions) directly from your email. No login required, yet all conversations, decisions, and even context from attachments and images are automatically - and securely - captured in Clarity. Sound like a dream? Join this class to learn how to save time and increase adoption with this easy innovation.
 -
 A Quick Reference Guide on setting up Custom Investments in Clarity’s Modern UX. Reviews setting up the Custom Investment, and creating Custom Investment Records.
 -
 This training document is a Rego Consulting Quick Reference Guide to assist with creating and management of a project team in Clarity’s Modern User Experience. The document reviews accessing teams, creating a team, allocating a team on an investment, as well as additional team related information.
 -
 This training document is a Rego Consulting Quick Reference Guide to assist with creating a new project in Clarity’s Modern User Experience. The document reviews this both in the Project Page and in the Project Tiles locations.
 -
 A Quick Reference Guide that reviews access to Project Tasks and Task To Dos in Clarity PPM’s Modern UX.
 -
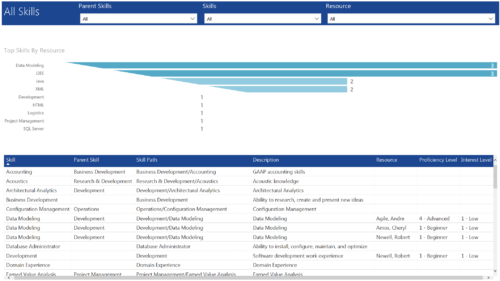 All Skills report provides project managers a single place to view number of resources having a particular skill and its detailed information. This report contains a bar graph and a grid. Top Skills by Resource: Bar graph that displays # of resources having a particular skill. Y- Axis represents various skills available in the system. Resource and Skill details grid: Grid that displays information such as Skill, its parent skill, Skill path, Skill Description, Resource having that skill & his proficiency and interest level in that skill. You can further narrow your search by Parent Skills, Skills and Resource.
 -
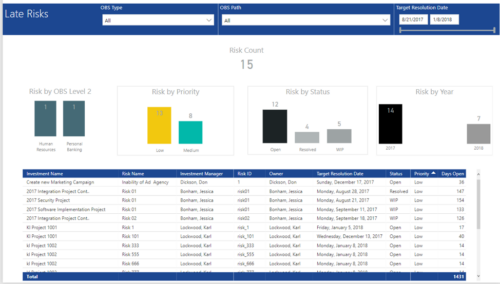 Late Risk report provides the Project Managers a single place to view all the Open Risks that are past their target resolution date. This report provides information such as Risk Count, Risks by OBS Level 2, Priority, Status and Year in Stacked Column Chart. In addition, this report has also Table view of Risk information such as Investment Name, Risk Name, Investment Manager, Risk ID, Owner, Target Resolution Date, Status, Priority and Days Open. User can further narrow their search by OBS Type & Path and Target Resolution Date.
 -
 A Quick Reference Guide that assists in managing project tasks in Clarity’s Modern UX via the Classic Gantt. Reviews how to open the Project Scheduler and use of the Gantt View.
 -
 A review of how AbbVie is driving greater visibility into projects at the Executive level and is eliminating/reducing duplicative work across the Business Technology Solutions organization by simplifying the overall PPM landscape. This has been accomplished through implementation of consistent processes supported by Clarity as well as through system integrations with legacy systems like SAP, Fieldglass, and other Project Scheduling tools.
 -
 To effectively practice Agile at scale, Clarity teams first need to identify various needs. This includes thinking through considerations for funding, investment prioritization, and spend management practices.
 -
 This training document is a Rego Consulting Quick Reference Guide to assist with the creation of Status Reports in Clarity’s Modern User Experience. This doc references version 16.2.1 views. Document covers the creation of Status Reports via the Status Module as well as the Status Report Module. Detail is provided on the widgets that can be used within the Status Report canvas as well as instructions on how to configure the canvas. Detail is also provided on how to Preview and Publish status reports.
 -
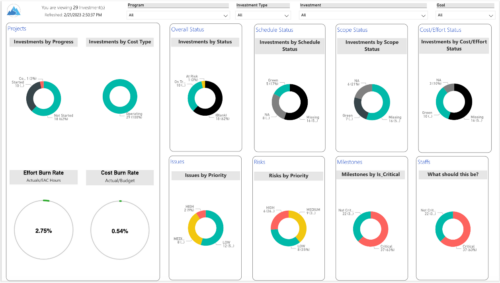 Gain an overview of program-level performance, track program milestones, and assess overall program health. Report Views include: • Change Requests • Program Costs Trend • Program Costs • Program Drill Thru • Program Effort • Program Gantt • Program Issues • Program Milestones • Program Risks • Program Staff • Program Status Reports • Program Summary • Program Tasks Demo Video - https://www.youtube.com/watch?v=6VceDIFjp-g&list=PLXJ5ktuWV0jiS9CvBpHvBIwpKPmA9uvwK&index=5 The main .rpt file will access data through the Data Warehouse. For clients on Rego’s AWS hosting, we have versions that work with Oracle and Postgres DB and access the live database, if the Rego Odata connector is being used.


Copyright 2023 • Rego Consulting Corporation • Privacy Policy