
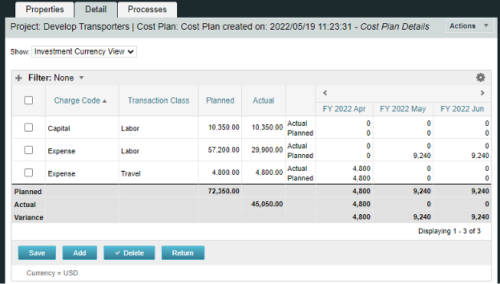
A process creating a new Cost Plan.
Cost Plan properties:
|
-
-
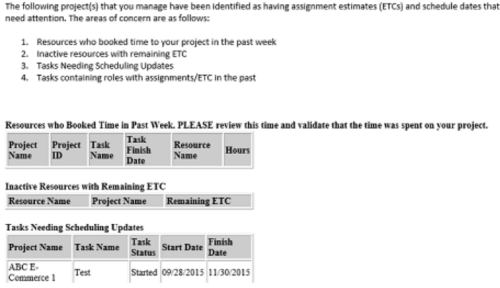 “PM Stalker – Project Validations & Issues” executes various queries against the Clarity database and sends an email to all PMs who have one or more projects with any of the following conditions:
- Resources have booked time in the past week (validation needed)
- Inactive Resources with ETCs still on the project
- Tasks past their Finish Date but not completed
- Task Role Assignments in the past
-
 A process that:
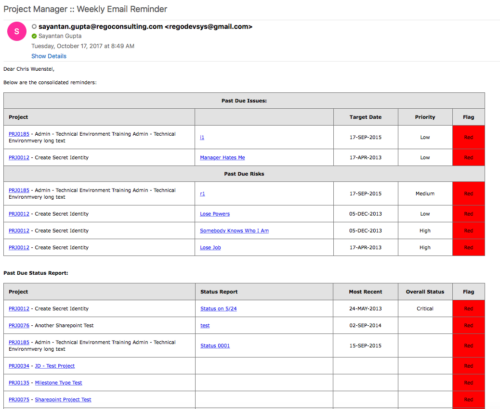
- is a weekly email to a project manager. All of the content will be for where the person getting the email is the PM
- shows aggregate data for all of their projects
- sends the PM a reminder email at the end of each week showing the items that the PM needs to do. Maybe call it Weekly PM reminder.
- Shows the mentioned data in sections as follows:
- Past Due issues
- Only active projects
- Only open issues – not resolved or closed
- Show project name, project ID, issue name, issue priority, target resolution date, color (only red or yellow)
- Logic for Yellow = where target resolution is within the next week
- Logic for Red = target resolution date is in the past
- URL LINK: to that issue
- Past Due Risks
- Only active projects
- Only open risks – not resolved or closed
- Show project name, project ID, risk name, risk priority, target resolution date, color (only red or yellow)
- Logic for Yellow = where target resolution is within the next week
- Logic for Red = target resolution date is in the past
- URL LINK: to that risk
- Past Due Status Report
- Only active projects
- Show project name, project ID, report date, most recent overall status, color (only red or yellow)
- Only 1 line per project – show even if there is no status report
- Logic for Yellow = where latest status report date > 7 days ago
- Logic for Red = latest status report date is > 14 days ago
- URL LINK: to status report list
- Past Due Milestones
- Only active projects
- Only open milestones
- Show project name, project ID, task name, task finish date, color (only red or yellow)
- Logic for Yellow = where finish is within the next week
- Logic for Red = finish date is in the past
- URL LINK: to that milestone
- Past Due Forecast
- Only active projects
- Show project name, project ID, last updated date, most recent total plan of record amount, color (only red or yellow)
- Only 1 line per project – show even if there is no finish plan
- Logic for Yellow = where last updated date of the plan of record > 14 days ago
- Logic for Red = where last updated date of the plan of record > 30 days ago
- URL LINK: to cost plan
- Allocation Summary for the Project Team
- Past Due issues
- Unfilled Roles that need to be staffed
- Resources Actuals +/- 25% of Allocation
- Resource ETC +/- 25% of Allocation
- Pending Change Controls / Approval Status
- In addition to the Past Due Milestones, upcoming milestones
- Budget Summary
- Actual vs. Planned
- Burndown estimate
-
 The interface runs using a MS Excel template called Project Allocation Upload that will be distributed to users.
- Configuration
- A master object called Allocation Upload Files will be created. The object will contain a required attachment field on the create page that will receive the Project Allocation Upload MS Excel file.
- A new sub-object called Allocation Upload Records will be created. This object will contain the fields necessary to receive the data rows from the Project Allocation Upload template.
- The master object will store the file level data while the sub-object will store the rows that belong to the file.
- Users must be granted security to view and edit the master and sub-objects in order to run the upload process.
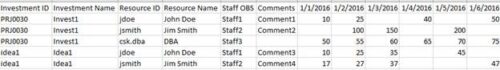
- Project Allocation Upload Template
- The Project Allocation Upload template must remain static. Any changes other than creating additional time periods or additional rows will cause the process to error.
- Only the Project Allocation Upload template can be used to load records to the new objects.
- The Project Allocation Upload will only accept months across the x-axis in the format DD/MM/YYYY. The month headers must appear in the first row of the template and contain the first day of the month.
- The template must be distributed to the users that will be using the upload functionality.
- Users will be required to enter an Investment ID and Resource ID so the process can correctly identify investments and resources to upload the allocation hours against.
- A Staff OBS is not required but can be populated by users to have the data uploaded into CA PPM.
- The owner of the Project Allocation Upload template is responsible for providing users a valid list of Staff OBS Units.
- Investments will not be created through the interface. As such a valid Investment ID must be provided.
- Resources can be added to the investment team through the interface. If a valid Resource ID is provided the resource’s allocation will be updated if the resource already exists on the investment. If the resource does not already exist on the investment the resource will be added to the team along with the allocation hours.
- The Project Allocation Upload template will accept hours, not allocation percentages. Because CA PPM stores allocations as percentages of a resource’s availability the upload process must convert hours to a percentage. As a result small rounding errors may occur in the neighborhood of .01 hours per month.
- Resources cannot be removed from investment teams through the interface.
- The Project Allocation Upload template will support allocation uploads to different instances of the same role on the same investment as long as different Staff OBS units are provided.
- If multiple instances of the same role are assigned to the investment with the same Staff OBS the process will not know which instance of the role to upload the hours to. In these cases the process will consider these records as invalid. The PM will need to manually remove one of the instances or upload the hours manually..
- If multiple instances of the same role with the same Staff OBS unit are assigned to the same investment in the upload template the monthly hours will be totaled by investment, by role, by Staff OBS.
- The allocation template will follow the format in the screenshot area.
- Process
- To initiate the Allocation Interface a user will create a new Allocation Upload File instance, attach the Project Allocation Upload Template, and save the record. The file attachment field is an “enter-once” field, meaning that once a value has been set it cannot be changed. If a user wishes to upload another field they will create a new record.
- After the file has been attached the user will be presented with two check box fields, one to Validate and one to Validate and Upload. Checking either or both options will initiate the process.
- The process will first determine if any sub-object instances exist for the file. In other words, do any records already exist in the Allocation Upload Records sub-object pertaining to the newly uploaded file. If there are no records in the sub-object the process will use the uploaded file and read its contents into the sub-object. If errors are encountered during the file read they will be written to the process console, the process will throw an error, and end.
- Next, records will be validated. Only the sub-object instances that belong to the master object will be validated. Records belonging to other master object instances will not be validated or processed. All records in a status of Ready for Processing, Failed Validation, or Xog Load Error will be validated. Records will fail validation if an investment is not found corresponding to the investment ID provided, a resource is not found corresponding to the resource ID provided, or the date provided is not valid, or a provided Staff OBS does not yield a match. Records that fail validation will be flagged as invalid along with a description as to why they failed validation. Records that pass validation will be flagged as Ready for Processing and locked. The sub-object instances can be exported to excel if further analysis is required. If the Validate & Upload option was not selected the process will end here.
- Regarding the Staff OBS. Only one OBS can be designed as the OBS that the interface will use to validate the Staff OBS records.
- The Staff OBS value from the template must match against the name of an OBS node in the designed Staff OBS.
- If the Staff OBS value matches against multiple nodes in the Staff OBS the record will be flagged as invalid as the process will not know which node to use.
- If the Validate & Upload option was selected the process will continue and any valid records will be xog’ed into the investment team. The xog will be executed as the user that initiated the process so any security rules enforced by xog will be respected by the process.
- Successful records will be flagged as Processed Successfully in the sub-object and remain locked. Records that did not load successfully, due to a xog error or security limitation will be flagged as Xog Load Error, unlocked, and updated with a description containing the full xog output.
- Records that failed validation or failed the xog load can be manually edited and revalidated, and attempt to be uploaded again. Subsequent runs of the process will not read in data from the file, but rather process only sub-object instances that currently exist.
- Configuration
-
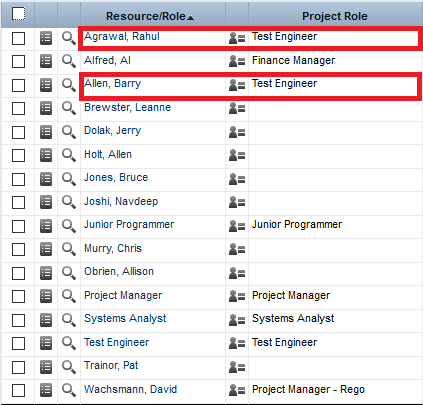
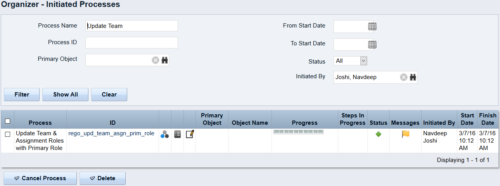 This process updates the team, assignment and timesheet roles with the primary role where they do not match. This way, the PM can push all roles to team and assignment for that project before they do a cost plan.
 -
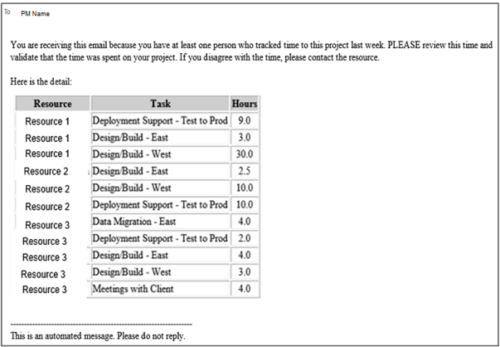 This process pulls in the total hours tracked, by resource, by task, for a given project for the weekly time period that ended. The information is sent to the Project Manager listed on the project. This process can be scheduled via the Execute a Process job.
 -
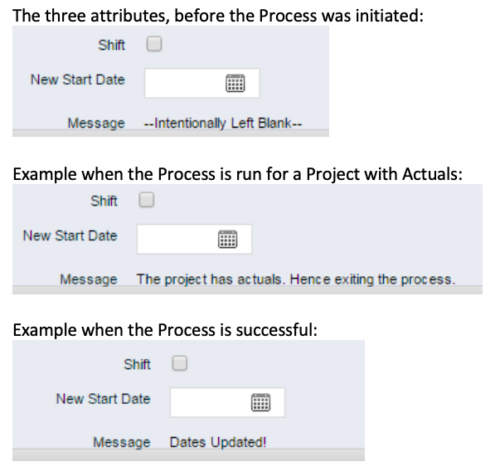 This process, Shift Project Dates, helps Project Managers change an entire Project / Idea’s dates to a new start date. Once the three attributes are added to the Idea /Project Views, the PM can trigger the process by entering a date in the New Start Date field and checking the Shift checkbox. The process runs automatically on Save. The process calculates the date difference between the original Start Date and New Start Date then shifts all Allocation, Task, and Assignment dates by the calculated difference. For example, if a Project is set to begin on January 1st and needs to be pushed to a February 1st start date, the process first determines that there are 31 days between the original start date and the new date. Next the process increases the start date for each Task, Allocation and Assignment by 31 days. NOTE: The process will shift Allocation dates regardless of resource restrictions such as a Termination Date or non-working time as marked on their calendar. The Team page will reflect the Available Start and Finish as shifted by the process, but the Allocation hours and % will take unavailable time into account. For example, if a shift process sets the start date for a resource to be after their date of termination the dates will change by the date difference, but the Allocation hours will correctly be calculated as zero.
 -
 When a task is marked as complete the process looks to any tasks that are dependent on the newly completed task. If a task is marked as “Not Started” and all of the dependency tasks are marked as complete then the process will change the task status to “Started” and email all resources that are assigned to the task that has started. The process notifies resources that a task is ready to start and saves the project manager the manual effort of updating dependent tasks. NOTE: The process relies on task dependencies and is most useful in those environments where task dependencies are managed.
 -
 The Grant Team Project Edit Rights workflow allows a project manager to grant Project – Edit Management rights to all users staffed on the project. This workflow saves not only the project manager time by allowing all users on the project to update information, but also saves the administrator time from granting each resource these rights individually. The process will also remove any rights from members that have been removed from the project.
 -
 The Move Role to Team/Assignment process takes the role from the resource object and pushes that information into the team and assignment objects when the role is NULL on the team and assignment objects. This happens normally, assuming a resource has their primary role populated. This process is needed if a resource or set of resources were added to projects without having their primary role filled in.
 -
 The Timesheet Approval - RM and PM process is an auto-start process that begins once the resource submits his or her timesheet. This process provides a checks-and-balances style to ensure that all resources entering time have entered the 40 hours. Once the timesheet is submitted, the process will lock the user’s timesheet to prevent editing. The process will then select the next action based on three different factors:
- The timesheet has less than 40 hours.
- The timesheet has 40 or more hours.
- The resource’s availability is less than 8hrs/day.
-
 The PM Stalker – Submit Status Report workflow process will email any project manager that has not submitted a status report in the last two weeks. This process will ensure that all status reports are kept up-to-date and provide management with a reliable overview of the status on the project.
