-
 Are you starting a demand/portfolio management implementation, or do you want to compare how you are using these functions vs. others or best practices? In this class we will discuss some best practices from successful customers.
 -
 Course Description: Do you want to analyze the cost and utilization of Agile development resources? Do you struggle to integrate financial information with work execution information from Agile tools such as Rally Software®, Jira, or VersionOne? This session explores reporting and dashboarding approaches to provide technology leaders with KPIs and trends for Agile execution, along with views that relate Agile team activity with cost and delivery.
 -
 Course Description: Are your project teams using SharePoint effectively and getting the most value out of it? Is document management a daily struggle? Learn how to use SharePoint with Clarity PPM to seamlessly improve collaboration and team productivity.
 -
 Would you like to get an overview of the fundamentals of Agile? This session will dispel the misconceptions of Agile and provide an understanding and definition of terms such as “bi-modal”, “Scrum”, “Kanban”, “weighted shortest job first” and “SAFe”. We will also talk about how Clarity fits into the Agile discussion and provide thoughts and practices on how PMOs are responding to this trending methodology.
 -
 Agile metrics can be very different from traditional waterfall metrics. This session will walk through some of the key Agile metrics describing how and why they are used. Effective methods in reporting and sharing will also be covered.
 -
 This portlet displays the % allocation of resources to projects. The portlet shows if the resource is allocated to the projects as an individual resource or as part of an Agile team, in which case it will display the resource % allocation to the team and what that will represent in terms of % allocation to the project. The Total Allocation % display the allocation of the resource to all investments is allocated to. Remaining Capacity and Over/Under columns will help identify the resources that still have availability and the ones that are over allocated.
 -
 This is a graphic portlet that pulls the average schedule variance by OBS node of the project. The portlet allows you to choose any OBS that is associated to the Project Object. Users can filter by:
- OBS Type
- If the project is financially approved?
- Financial Status
-
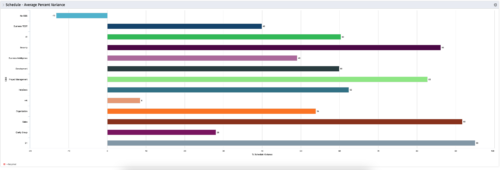
 Bar Chart displays average percent variance for all active projects by OBS unit. Percent variance = Planned Cost - Budgeted Cost / Budgeted Cost * 100. Projects with no Budgeted Cost are ignored for the calculation. Then all project variance percentages are algebraically added (some may be negative), and divided by total projects with a variance. This yields the Average Percent Variance. This calculation is performed for active projects in each OBS unit. OBS units include all units at all levels where projects are attached. Portlet filterable by OBS, Financial Status, and Financially Approved. Vertical axis = OBS Unit Name. Horizontal axis = Variance Percent. Data value = Average Percent Variance. Mouseover value = OBS Name + Average Variance Percent.
 -
 Part of the Business Transformation collection, this bar-chart portlet displays number of investments per stage. This provides a holistic overview of where the projects are within the organization.
 -
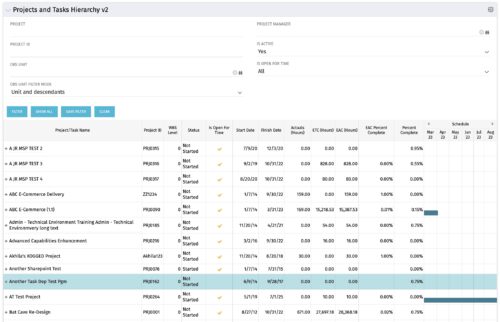 Grid Portlet displays project and task data--including name, dates, status, effort, %Complete, and schedule. Portlet initially displays project data. But there is a + sign toggle, which, when clicked, reveals task data, and the toggle becomes a – sign. User can choose to Automatically Expand all levels from Options Icon>Configure>List Column Section>Options. Portlet supports up to 10 levels of WBS. Portlet filterable by project name and ID, OBS structure, manager name, active/inactive, and open for time entry.
 -
Grid Portlet displays project and task data--including name, dates, status, effort, %Complete, and schedule. Portlet initially displays project data. But there is a + sign toggle, which, when clicked, reveals task data, and the toggle becomes a – sign. User can choose to Automatically Expand all levels from Options Icon>Configure>List Column Section>Options. Portlet supports up to 10 levels of WBS. Portlet filterable by project name and ID, OBS structure, manager name, active/inactive, and open for time entry.
-
 This portlet shows the variance between the budgeted cost and the planned cost for projects. This allows for the variance to be displayed between what was planned and what was approved. This provides the PMs with the ability to better plan the costs.


Copyright 2023 • Rego Consulting Corporation • Privacy Policy