-
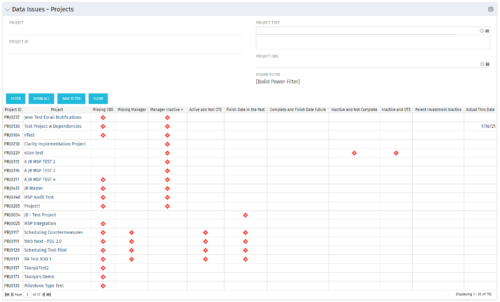 The Project Data Issues portlet is used to identify data exceptions related to project setup. This portlet helps to identify where projects are missing key data or are possibly sitting in an exception state. This view will show projects that have one or many exceptions, including inactive projects. The user may also narrow the results by project, OBS, or project type.
 -
The Project Data Issues portlet is used to identify data exceptions related to project setup. This portlet helps to identify where projects are missing key data or are possibly sitting in an exception state. This view will show projects that have one or many exceptions, including inactive projects. The user may also narrow the results by project, OBS, or project type.
-
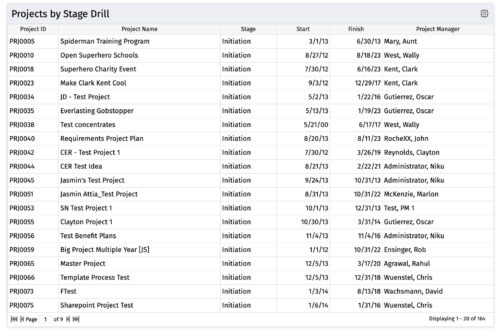
 The portlet, Count by Stage with Drilldown is a simple pie based on stage OOTB field. The drill down portlet has stage as a column. Clicking on any of the segments, e.g. Initiation, redirects to the Projects by Stage Drill portlet.
 -
The portlet, Count by Stage with Drilldown is a simple pie based on stage OOTB field. The drill down portlet has stage as a column. Clicking on any of the segments, e.g. Initiation, redirects to the Projects by Stage Drill portlet.
-
The portlet, Count by Stage with Drilldown is a simple pie based on stage OOTB field. The drill down portlet has stage as a column. Clicking on any of the segments, e.g. Initiation, redirects to the Projects by Stage Drill portlet.
-
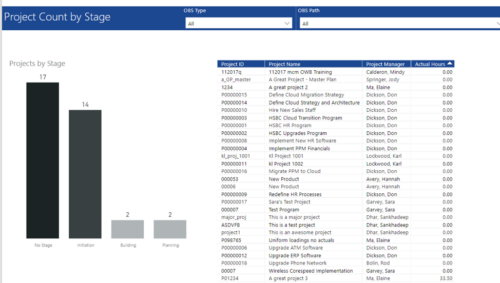 Project Count by Stage report has Stacked Column chart that displays count of Projects by Stage such as Initiation, Building, Planning etc. Also, there is a table view with Project ID, Project Name, Project Manager and Actual hours details. User can further narrow their search by OBS Type & Path.
 -
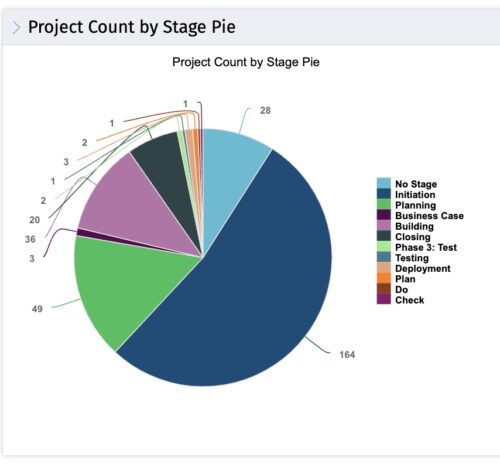
 This portlet displays the projects by Stage in a pie chart. Every piece of the pie chart represents a stage of the Project Management methodology applied. The portlet also shows the number of projects on each stage. The legend displays all the different project stages appearing on the portlet. This portlet can be filtered to show only projects from a particular OBS unit or for a particular Project Manager.
 -
This portlet displays the projects by Stage in a pie chart. Every piece of the pie chart represents a stage of the Project Management methodology applied. The portlet also shows the number of projects on each stage. The legend displays all the different project stages appearing on the portlet. This portlet can be filtered to show only projects from a particular OBS unit or for a particular Project Manager.
-
 Part of the Business Transformation collection, this bar-chart portlet displays number of investments per stage. This provides a holistic overview of where the projects are within the organization.
 -
Part of the Business Transformation collection, this bar-chart portlet displays number of investments per stage. This provides a holistic overview of where the projects are within the organization.


Copyright 2023 • Rego Consulting Corporation • Privacy Policy