-
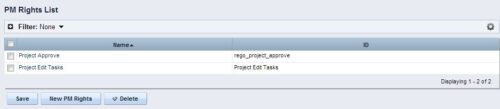 The Allow PM to Give Certain Rights modification allows the project manager to delegate rights (chosen by the administrator on the PM Rights object) on his or her projects. This modification eliminates the need for project managers to request additional rights through the PMO/management and simplifies the entire process for everyone involved. The system administrator is able to customize the PM Rights object to pick which rights should be granted to users by the process. The process begins when a change is made on the newly created “Grant / Revoke” field on the project object. The process will then grant or revoke (depending on what option is selected) any rights listed in the PM Rights object to the user in the “Assign PM Rights” field on the project object.
 -
 Finding the right project manager can be tricky. How do you know which candidates have the appropriate leadership, forecasting, and problem-solving skills? Interviewing strategies can make all the difference. This paper discusses important ways you can prepare for a project manager interview. It points out hazards to sidestep and best practices for identifying candidates with the right proficiency. This White Paper is downloaded from the Rego Consulting site. You will be asked to provide your email address and current ppm tool. - http://info.regoconsulting.com/how-to-hire-the-right-pm ** No Download - Do not Add to Cart **
 -
 Today, most high-performing organizations recognize that moving from project-funding to product-funding is necessary for achieving business agility. What doesn't exist in the industry is guidance on how to support the transition from a tooling perspective. In this session, Rego Expert Guide Robert Sirard presents a practical and tactical approach to using Clarity's PPM software and Rally's Agile software together to plan, track, monitor, and deliver products. At Rego, we realize that not everything needs to be done in an Agile manner, so Robert will discuss how this approach also supports a mix of traditional and Agile investments. ** No Download - Do not Add to Cart ** There is no download for this content. Follow the link to view - http://info.regoconsulting.com/product-funding-clarity-rally-may-2021
 -
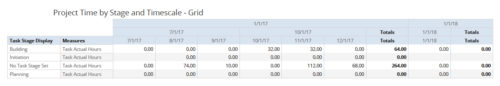 Time by Stage and Timescale – Grid report displays hours for all tasks on projects by their stage for a user-defined time period. Information can be drilled down to Year, Quarter or Monthly level. Using this report, Management can determine if excess time is being spent on a certain task stage within a project You can further narrow your search by Month Start Date, OBS Type & Path, Is Project Active? And Is Template?
 -
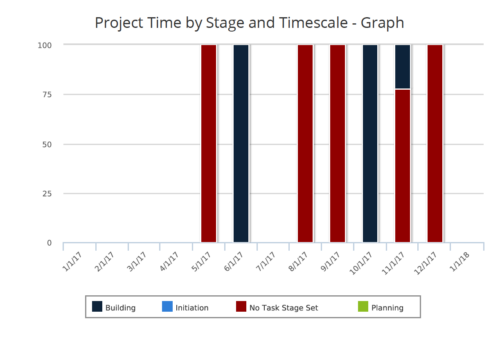 Time by Stage and Timescale – Graph report is a stacked column chart that displays hours for all tasks on projects by their stage for a user-defined time period. Using this report, Management can determine if excess time is being spent on a certain task stage within a project You can further narrow your search by Month Start Date, OBS Type & Path, Is Project Active? And Is Template?
 -
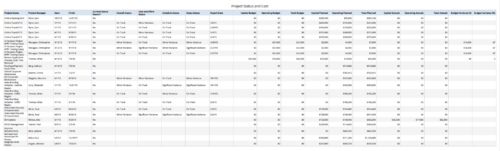 Project Status and Costs report gives the Project Manager a single place to view various Project Statuses ( Cost and Effort, Schedule, Scope and Overall ) and Costs ( Planned, Budget & Actuals ) for multiple projects. User can further narrow their search by OBS Type & Path, Project Name, Project Manager and Is Project Active?.
 -
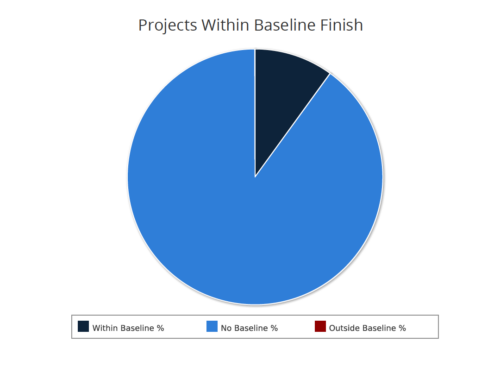 Projects within baseline finish report is a pie chart that displays projects that have a baseline or do not have a baseline. Projects with baseline are further segregated into within or outside baseline finish. Mouse over on the pie chart displays the % of projects within a particular category. You can further narrow your search by OBS Type & Path, Project Finish Date and Is Project Active?.
 -
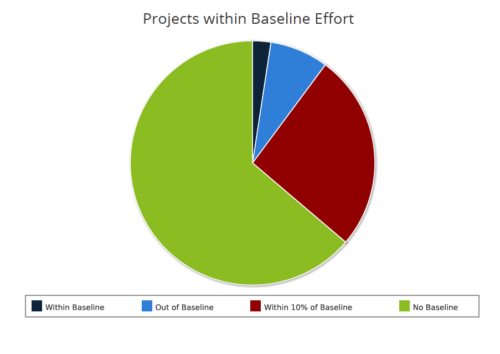 Projects within baseline effort report is a pie chart that displays projects baseline effort by their categories. Legend displays various baseline effort categories: Within Baseline, Out of Baseline, Within 10% Baseline and No Baseline. Mouse over on the pie chart displays the total number of projects within that particular category. You can further narrow your search by OBS Type & Path and Is Project Active?.
 -
 Are you struggling with implementing Agile tools in your organization in addition to CA PPM? This class will review best practices for implementing agile tools in conjunction with CA PPM - living in a Bi-Modal world. We will discuss how CA PPM can be used to govern both types of work and teams and how Agile tools should interface into CA PPM.
 -

 Pie Chart displays projects by Baseline Finish Variance—is current project finish beyond baseline finish; or is current project finish on or before baseline finish. Filterable by OBS structure and Finish Date range. Data labels show percent within baseline vs percent outside baseline. Mouse-over shows Within or Outside label and percent of total projects. Legend shows color coded Within Baseline and Outside Baseline labels. Drilldown: Clicking on a pie slice yields a grid portlet of projects either Within or Outside Baseline.
 -
 Rego’s training deck for Project Management in Clarity using the Classic UX and the Phoenix theme. Reviews the OBS, WBS, Templates, Terms, Allocation vs ETC and more.
 -
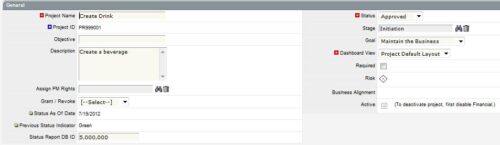
 A Quick Reference Guide to assist in the process of populating Project Properties. The document uses screen shots from the Classic UX with the Phoenix theme.


Copyright 2023 • Rego Consulting Corporation • Privacy Policy