-
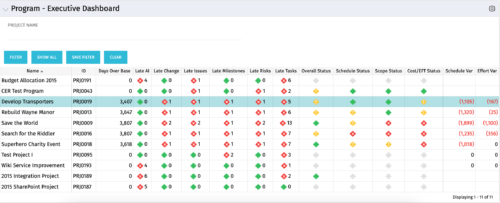 The Program Executive Dashboard portlet displays information regarding sub-projects on a program. It provides a one-stop place for the PMO or management to view all critical information about projects under a specific program. The portlet displays status indicators, dates for late items, variances and days over base, it also displays the project status fields from the Status Report sub-object.
 -
The Program Executive Dashboard portlet displays information regarding sub-projects on a program. It provides a one-stop place for the PMO or management to view all critical information about projects under a specific program. The portlet displays status indicators, dates for late items, variances and days over base, it also displays the project status fields from the Status Report sub-object.
-
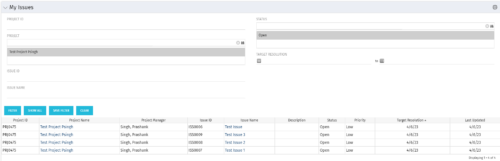 The My Issues portlet displays all issues within active project that the logged in user is assigned to. The portlet provides the logged in user a single place to view issues across multiple projects without having to go into each project individually. The filter then allows the user to narrow their search by Issue ID, Issue Name, Project ID, Project Name, and Issue Status. You may also narrow the view to display issues with a target resolution date within a certain date range.
 -
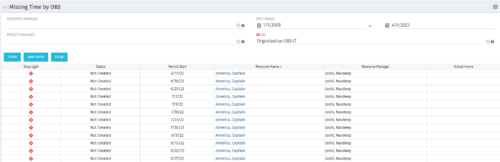 The Missing Time by OBS portlet displays all missing or late timesheets for resources staffed within a specific OBS. Resources will be included if they are open for time entry, have the track mode of ‘Clarity’ and have a timesheet that is not posted. The portlet accommodates for hire and termination dates. Also, the portlet only shows resources that the active user has the security rights to view. Administrators and the Project Management Office may use this portlet to determine the timesheet status of all resources within a specific OBS in open time periods. This portlet allows a user to quickly search by OBS and view all timesheets under that area. After selecting the OBS, the user can also filter on time period start date, Resource Manager and/or Project Manager. The portlet will display a ‘Stop Light’ indicator based on timesheet status, the status, period start, Resource Name, Resource Manager and any actual hours entered for the timesheet.
 -
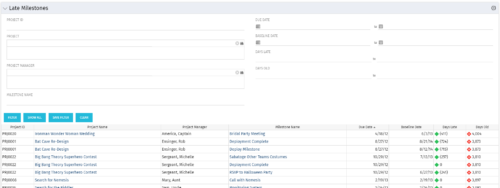 The Late Milestones portlet displays all action items related to active projects that the logged in user has view rights to. The milestones displayed are those that are not closed but are past their finish date or past their baseline finish date. The portlet provides a Project Manager the ability to view and track action items across multiple projects without going into each project individually. This portlet provides a single consolidated view of late milestones based on the current project baseline, and the age of the milestone. The portlet will display the Project ID, Project Name, Project Manager, Milestone Name, Due Date, Baseline Date, Days Late (calculated from baseline dates), and Days Old (calculated from today’s date).
 -
 The Late Issues portlet displays all issues related to active projects that the logged in user has view rights to. The issues displayed are those that are past their target resolution date but not Closed or Resolved. The portlet provides a Project Manager the ability to view and track issues across multiple projects without going into each project individually. This portlet displays the issue, the associated project name and project manager, as well as the issue owner, target resolution date, status, and priority of the issue, along with the total number of days the issue has been open. The user has the ability to filter by several criteria in order to narrow down the late issues.
 -
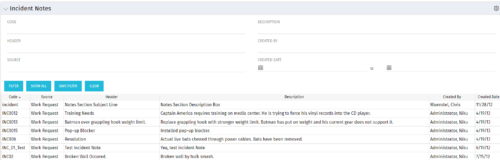 The Incident Notes portlet displays all of the notes that have been entered against Incidents in a single view. This allows users to more efficiently look at the notes, regardless of security rights, without having to enter each incident individually to view them.
 -
 The Resource Data Issues portlet is used to identify data exceptions related to resource setup. This portlet helps to identify where resources are missing key data or are possibly sitting in an exception state. This view will show resources that have one or many exceptions, including inactive resources. There is no security built into this portlet - all resources will show. The only required field in the filter is Days, which is the number of days since the user last logged in. The user may also narrow the results by resource, OBS, or project type.
 -
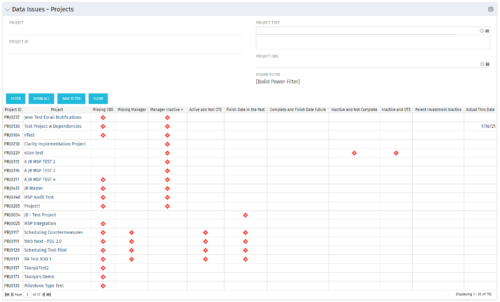 The Project Data Issues portlet is used to identify data exceptions related to project setup. This portlet helps to identify where projects are missing key data or are possibly sitting in an exception state. This view will show projects that have one or many exceptions, including inactive projects. The user may also narrow the results by project, OBS, or project type.
 -
The Project Data Issues portlet is used to identify data exceptions related to project setup. This portlet helps to identify where projects are missing key data or are possibly sitting in an exception state. This view will show projects that have one or many exceptions, including inactive projects. The user may also narrow the results by project, OBS, or project type.
-
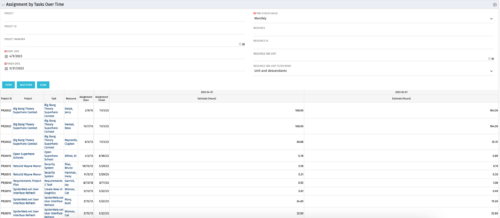 The Assignments by Task Over Time portlet displays all assignments by task for all resources using the timeslices. This portlet is useful for determining which tasks a user is assigned to or how many hours the user is assigned to a task. The user may filter on certain criteria that include: project name/ID, date range, resource name/ID, and resource OBS unit.
 -
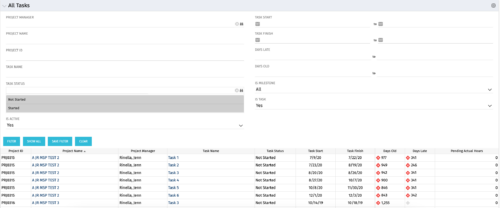 The All Tasks portlet displays all tasks related to active projects that the logged in user has view rights to. The portlet provides the project manager a single place to view tasks across multiple projects without having to go into each project individually, and allows for more efficient management and reporting across projects. The portlet displays project actuals and estimates from the project (datamart tables). The portlet allows analysis like:
- PMs may have several critical tasks that were supposed to start on a certain date. To verify progress, they filter for that start date to perform a review of the tasks.
- PMs can review days late to see how tasks are doing against the baseline date (<7 days is green, 7-14 is yellow, and >14 is red)
- PMs can review days old to see how tasks are doing against today’s date (<7 days is green, 7-14 is yellow, and >14 is red)
Column Label Description Project ID Unique project identifier Project Name Name of the project Project Manager Manager of the project Task Name Name of the task Task Status Not Started, Started, or Completed Task Start Start Date of this task Task Finish Finish Date of this task -
The All Tasks portlet displays all tasks related to active projects that the logged in user has view rights to. The portlet provides the project manager a single place to view tasks across multiple projects without having to go into each project individually, and allows for more efficient management and reporting across projects. The portlet displays project actuals and estimates from the project (datamart tables). The portlet allows analysis like:
- PMs may have several critical tasks that were supposed to start on a certain date. To verify progress, they filter for that start date to perform a review of the tasks.
- PMs can review days late to see how tasks are doing against the baseline date (<7 days is green, 7-14 is yellow, and >14 is red)
- PMs can review days old to see how tasks are doing against today’s date (<7 days is green, 7-14 is yellow, and >14 is red)
Column Label Description Project ID Unique project identifier Project Name Name of the project Project Manager Manager of the project Task Name Name of the task Task Status Not Started, Started, or Completed Task Start Start Date of this task Task Finish Finish Date of this task -
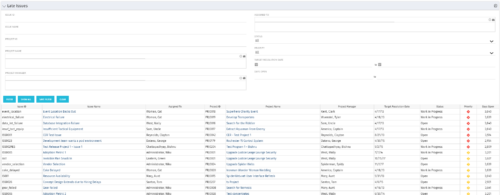
 The All Risks portlet displays all risks related to active projects that the logged in user has view rights to access. The portlet provides the project manager a single place to view risks across multiple projects without having to go into each project individually, and allows for more efficient management and reporting across projects. The portlet displays Project ID, Project, Risk ID, Risk, Category, Assigned to, Status, Probability, Impact, Priority, Target Resolution Date, and Days opened. The filter allows narrowing down of the risks by several different criteria. Note: Only the projects that the user has viewer rights to see will show up in the list.
 -
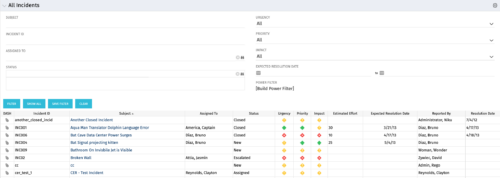 The All Incidents portlet shows all Incidents the user has view rights on and provides a single view to increase ease of management. Status indicators provide a quick overview of incident statuses so a user may prioritize. The filter then allows the user to narrow their search using date ranges and/or resources assigned. Other alternatives for filtering include the status, urgency, priority or impact of the Incident.
 -
The All Incidents portlet shows all Incidents the user has view rights on and provides a single view to increase ease of management. Status indicators provide a quick overview of incident statuses so a user may prioritize. The filter then allows the user to narrow their search using date ranges and/or resources assigned. Other alternatives for filtering include the status, urgency, priority or impact of the Incident.
-
 Very seldom will an organization only deliver using Agile. Some work lends itself better in using Waterfall. The need for a dual operating model will drive the need for a deliberate tooling architecture that will usually include a PPM and an Agile tool.
 -
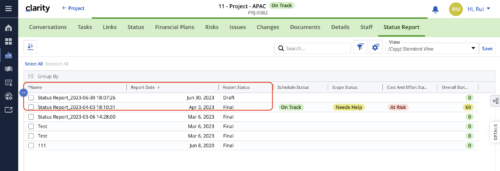 When marking a Status Report 'Final' in a grid/list view, the system doesn't create a new 'Draft' report like it does when using the Status Report UI. For groups that prefer to manage in a grid/list, they need to always have a draft.
 -
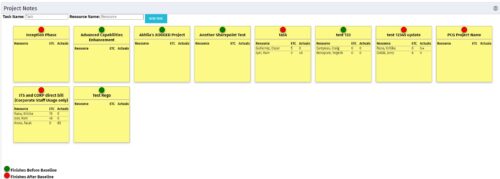 The Task-At-A-Glance Notes portlet provides a view of project tasks and assignments in an easy to read format, similar to popular sticky – note applications. This portlet will display all tasks on a project, ‘pinning’ them to a dashboard. Each task will include the resources assigned to them, as well as the ETCs left for the resource, and the actuals that they have posted. Each sticky note allows you to link to the task details, as well as the resource assignment details. In addition to important assignment detail, each pin on the individual task’s note indicates if the task finishes before the baseline (green), or if it is going to finish after the baseline (red).
 -
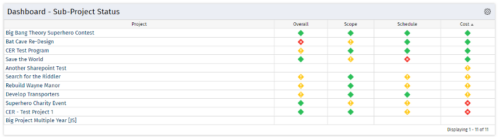 The Program Dashboard Sub-Project Status portlet gives the ability to view the most recent status report for all sub-projects on a program. The portlet will pull the "id" from the page it is placed on, so this portlet is usually placed on the dashboard tab. This portlet displays each sub-project, type of status, and the symbol related to the severity.
 -
The Program Dashboard Sub-Project Status portlet gives the ability to view the most recent status report for all sub-projects on a program. The portlet will pull the "id" from the page it is placed on, so this portlet is usually placed on the dashboard tab. This portlet displays each sub-project, type of status, and the symbol related to the severity.
-
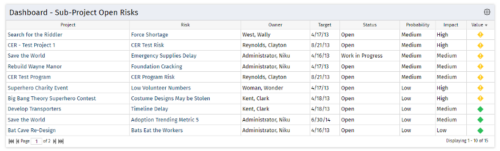 The Program Dashboard Sub-Project Open Risks portlet gives the ability to view all risks on the sub-projects of a program that are not closed or resolved. The portlet will pull the "id" from the page it is placed on, so this portlet is usually placed on the dashboard tab. The portlet sorts the issues first by value, in descending order, and then by target date. It displays the sub-project name, risk name, owner, target date, status, probability, impact and value.
 -
The Program Dashboard Sub-Project Open Risks portlet gives the ability to view all risks on the sub-projects of a program that are not closed or resolved. The portlet will pull the "id" from the page it is placed on, so this portlet is usually placed on the dashboard tab. The portlet sorts the issues first by value, in descending order, and then by target date. It displays the sub-project name, risk name, owner, target date, status, probability, impact and value.


Copyright 2023 • Rego Consulting Corporation • Privacy Policy