| Column Label | Description |
| Project | Name of the Project |
| Subject | Defines the name for Action Item |
| Created By | Resource who created the Action Item |
| Assigned To | Resource who the Action Item is Assigned to |
| Due Date | Date the Action Item is due for completion |
| Prty | Specifies the priority level of the Action Item |
| Action Item ID | Internal ID used by the query |
| Created By ID | Internal ID used by the query |
| Created Date | Date the Action Item was created |
| Days Open | No. of days the Status of Action Item has remained opened since it was created |
| Priority Name | Based on high, medium, or low priority with corresponding red, yellow, or green stoplights |
| Project DB ID | Internal ID used by the query |
| Project ID | Unique ID of the Project within Clarity |
| Project Manager | Project Manager |
790 results
-
 The Program Dashboard Sub Project Action Items portlet display Action Items of Sub Projects in a Program. The portlet will pull the "Action Items" from all the sub projects in the Program, and this information is placed on the Dashboard tab. This portlet displays each Project, name of the Action Item as mentioned in the Subject, and the resource who Created this Action Item. Assigned To field will display the resource to whom the Action Item has been Assigned. Due Date mentions the date the Action Item will be completed and the Priority level of the Action Item is a stoplight showing red, yellow and green for the different levels of priority. The table below describes the available columns in the portlet. The first 6 are configured in the default view:
 -
 Out of the box, there is no way to export or report on the Modern UX Roadmap Grid view. This report allows the end user to select one or more roadmaps and provides an exportable view of several OOTB fields from those roadmaps. When exported to and open in excel, the first tab will display a combined view of all selected Roadmaps, one row for every Roadmap Item, and additional tabs will display Roadmap-specific views. Custom attributes may be added to the report by your developers.
 -
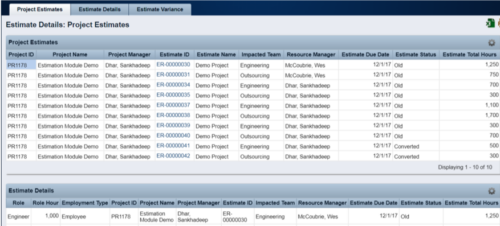 The Rego Estimation Module Provides a more accurate estimate earlier in the idea/project lifecycle.
- Is applied consistently so it can be improved.
- Retains the data in Clarity to enable analysis.
- Provides ongoing feedback by comparing estimates to current EAC.
- Provides historical record of estimating for projects overall as well as change requests.
-
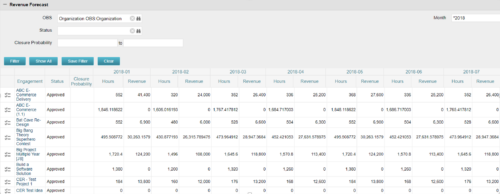
The Revenue Forecast portlet displays projected revenue at a project level broken out by month. This portlet assists in viewing all project revenue data at once and making it easily exportable. The table below describes the available filter fields in the portlet. Column Label Description OBS OBS to filter projects with Status Status of the project Closure Probability ? Months Month(s) of Project Revenue to display -

The Revenue Forecast portlet displays projected revenue at a project level broken out by month. This portlet assists in viewing all project revenue data at once and making it easily exportable. The table below describes the available filter fields in the portlet. Column Label Description OBS OBS to filter projects with Status Status of the project Closure Probability ? Months Month(s) of Project Revenue to display -
 This training document is a Rego Consulting Quick Reference Guide to assist with Task Assignments in Clarity’s Modern User Experience. This doc references version 16.0.3 views. Document provides detail on how to use the Assignments tab to add resources to tasks, tips on how to group resource data, updating ETC values and Per-Period Metrics.
 -
 This training document is a Rego Consulting Quick Reference Guide to assist with the management of Project Tasks via the PPM Gantt view in Clarity’s Modern User Experience. This doc references version 16.0.2 views. Doc covers PPM Gantt, View Legend, Menu Icons, Create New Task, Indent Tasks, Move Tasks and Set Dependencies.
 -
 This training document is a Rego Consulting Quick Reference Guide to assist with the use of the Staffing Plan in Clarity’s Modern User Experience. This doc references version 16.0.2 views. Document provides information on how to swap between views to see investments by resource or resources by investment. Instructions on filtering are provided, as well as detail on how to update the unit of measure between FTE (Full Time Equivalent) and Hours. Tips are provided on how to expand the list of investments within each view and how to view the properties for the allocations. A Legend is also documented to provide information on each of the icons that are displayed on this page.
 -

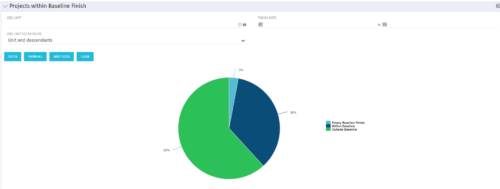 Pie Chart displays projects by Baseline Finish Variance—is current project finish beyond baseline finish; or is current project finish on or before baseline finish. Filterable by OBS structure and Finish Date range. Data labels show percent within baseline vs percent outside baseline. Mouse-over shows Within or Outside label and percent of total projects. Legend shows color coded Within Baseline and Outside Baseline labels. Drilldown: Clicking on a pie slice yields a grid portlet of projects either Within or Outside Baseline.
 -

 Pie Chart displays projects by Baseline Finish Variance—is current project finish beyond baseline finish; or is current project finish on or before baseline finish. Filterable by OBS structure and Finish Date range. Data labels show percent within baseline vs percent outside baseline. Mouse-over shows Within or Outside label and percent of total projects. Legend shows color coded Within Baseline and Outside Baseline labels. Drilldown: Clicking on a pie slice yields a grid portlet of projects either Within or Outside Baseline.

